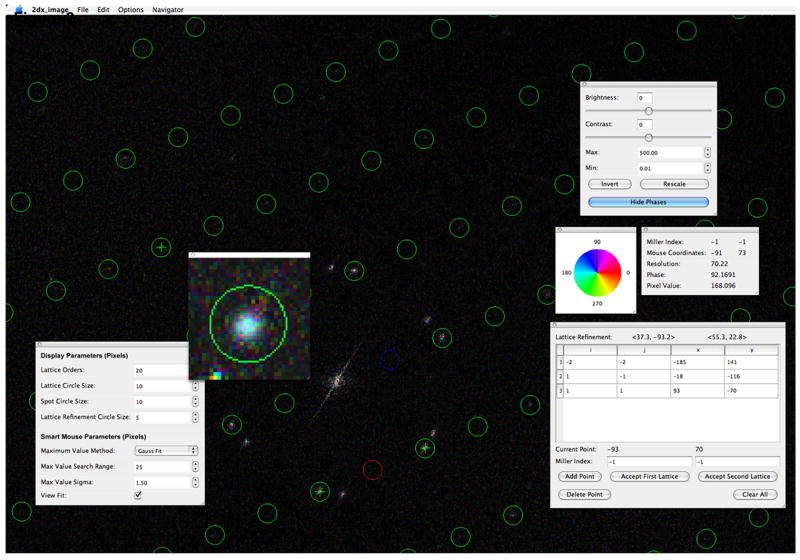
Figure 2.
The manual lattice determination function of the full-screen browser in 2dx_image. The calculated FFT of an image is displayed, here optionally with color-coded phase information (top right panel). The currently valid lattice is indicated by circles, with spot (1,0) in red, and (0,1) in blue. The information of the current mouse pointer location is displayed in the panel on the right. The user can manually identify individual peak positions by mouse-click and then assign Miller indices to the peak, while the most likely Miller indices based on the current lattice estimate are automatically pre-entered as default values (bottom right panel). Double-clicking close to a peak in the FFT will activate the smart-mouse function, which either selects the highest peak within a given radial distance, or will perform a Gauss profile peak search over the pixels within the given radius (here 25 pixels) and select the best fitting location as click-location. Parameters for the smart mouse function can be adjusted in the panel bottom left. The Gauss peak fit at the automatically re-centered location is displayed in the zoomed window (center left panel).

