
Figure 2.
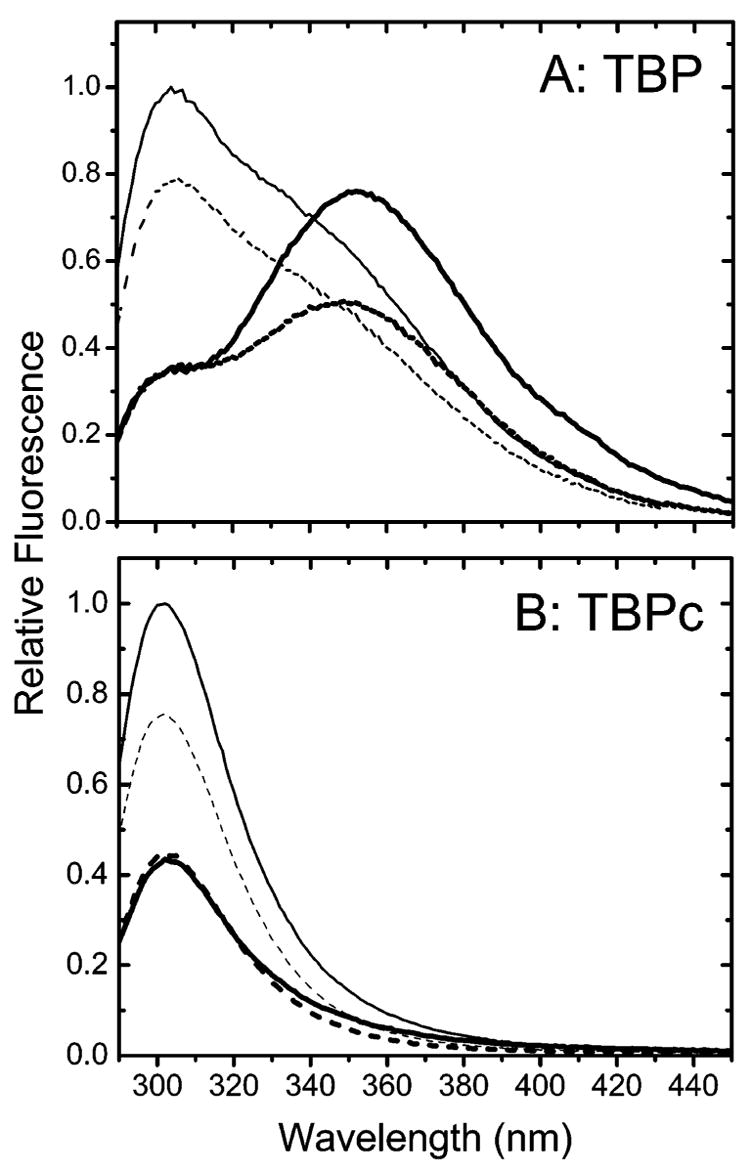
Normalized fluorescence emission spectra of TBP (A) and TBPc (B) obtained following excitation at 275 nm in the absence (—) or presence of 100 mM KI (- - -). The thick lines depict data for the TBP–DNA and TBPc–DNA complexes.
Official websites use .gov
A
.gov website belongs to an official
government organization in the United States.
Secure .gov websites use HTTPS
A lock (
) or https:// means you've safely
connected to the .gov website. Share sensitive
information only on official, secure websites.
Normalized fluorescence emission spectra of TBP (A) and TBPc (B) obtained following excitation at 275 nm in the absence (—) or presence of 100 mM KI (- - -). The thick lines depict data for the TBP–DNA and TBPc–DNA complexes.