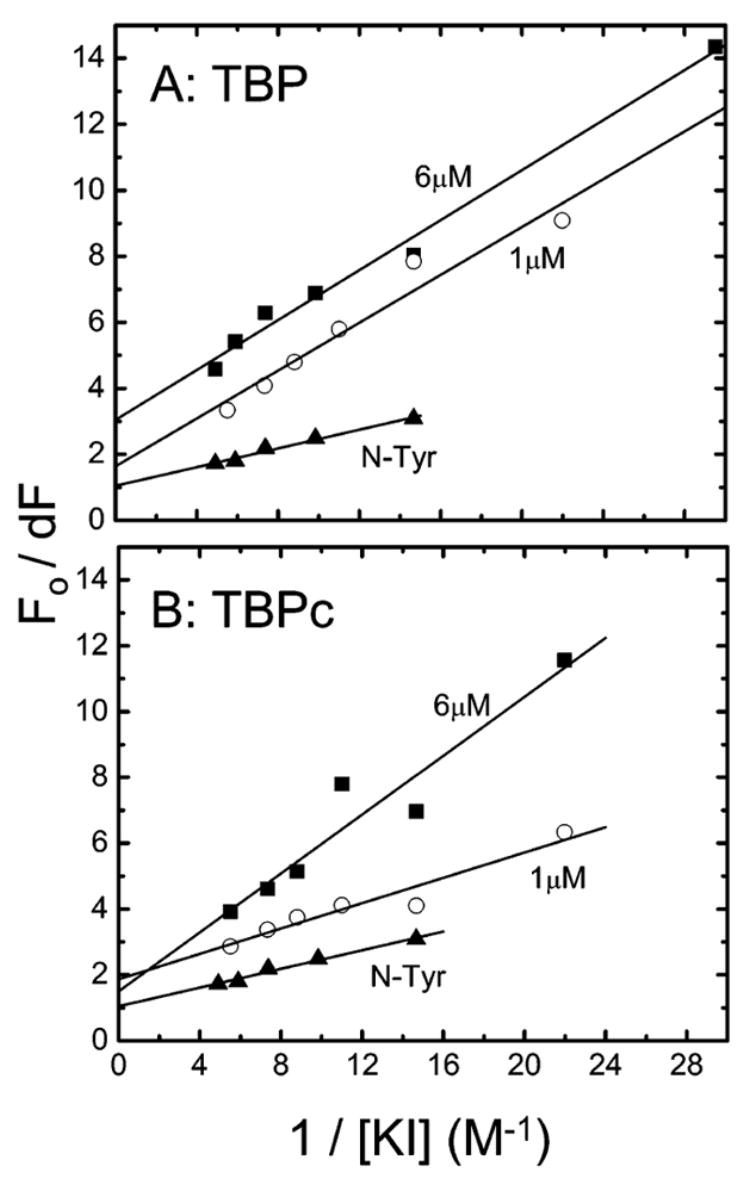
Figure 4.

Modified Stern–Volmer plots for the quenching by iodide of TBP (A) and TBPc (B) tyrosine fluorescence monitored at 306 nm following excitation at 275 nm. The analyzed solutions are the free proteins at 6 (■) or 1 μM (○) and N-Tyr (▲). The quantities dF = F0 − F, F0, and F are the protein’s fluorescence intensities in the absence or presence of the quencher KI; see eq 2 (Experimental Procedures).
