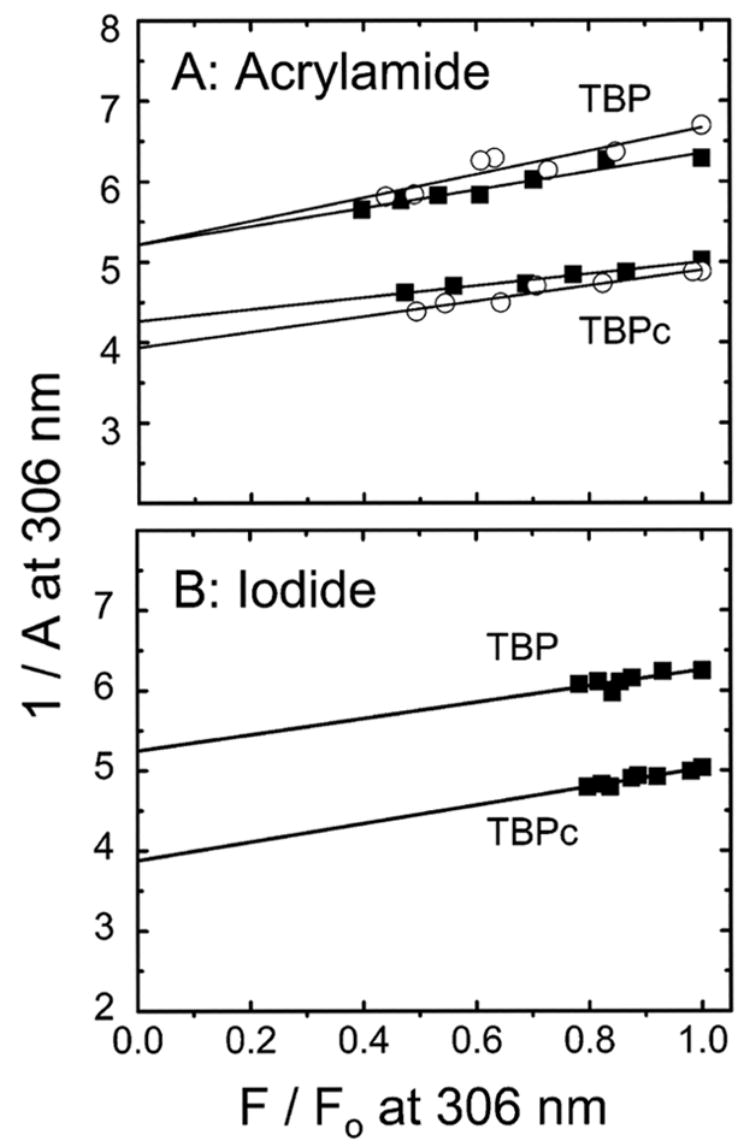
Figure 5.

Perrin plots for the quenching-resolved emission anisotropy of tyrosine fluorescence of TBP and TBPc (excitation at 275 nm and emission at 306 nm) by acrylamide (A) and iodide (B): free protein at 6 μM (■) and TBP–DNA complex at 6 μM (○). The data for the TBP–DNA complex are not shown in panel B since its tyrosine fluorescence is inaccessible to iodide. The parameter A is the fluorescence anisotropy (eq 3, Experimental Procedures); F0 and F are defined in the legend of Figure 4.
