
Figure 6.
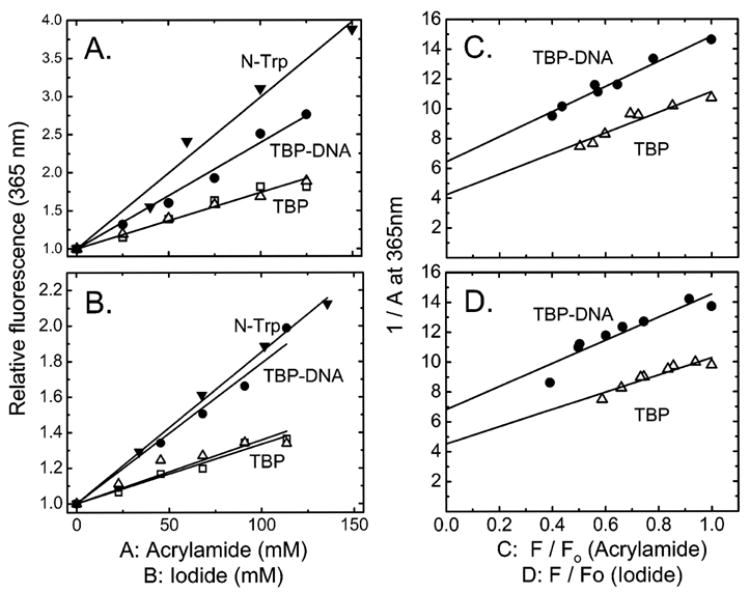
Stern–Volmer plots (A and B) and Perrin plots (C and D) for the quenching of tryptophan fluorescence (excitation at 275 nm and emission at 365 nm) of TBP by acrylamide (A and C) and iodide (B and D). The straight lines represent the best fit to eqs 1 and 3. Conditions: TBP at 1 (□) and 6 μM (△) and TBP at 6 μM complexed with a 1.2-fold molar excess of DNA bearing the sequence TATAAAAG (●) or N-acetyl-L-tryptophan ethyl ester (▼). The parameters A, F0, and F are the same as in Figures 4 and 5.