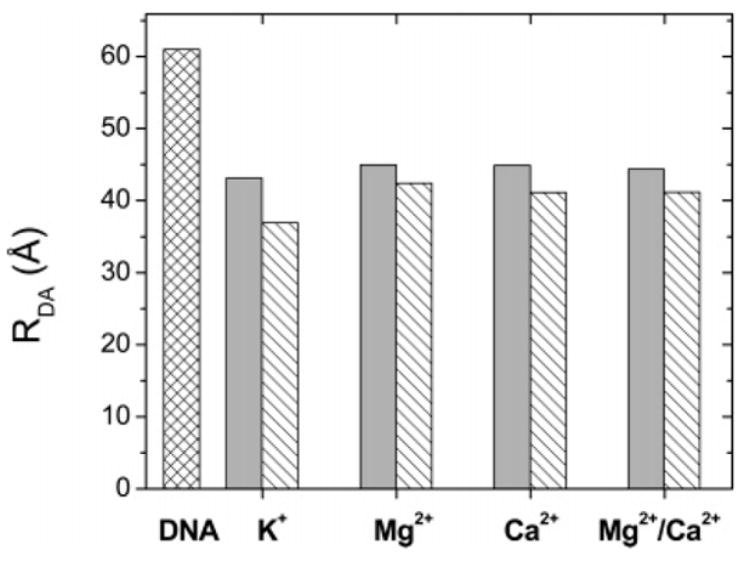
Figure 9.

End-to-end distance of the 14 bp duplex free (cross-hatched bars) and in the complex with TBP (solid gray bars) or TBPc (hatched bars) as a function of the indicated chloride salt of the indicated ion or ions present in the buffer. RDA (angstroms) is the end-to-end DNA distance calculated as described in Experimental Procedures. DNA represents the free DNA in all the solutions. The other columns represent the protein–DNA complexes under the same experimental conditions as described in the legend of Figure 8.
