
Figure 2. Negative correlation between the rate of CG->TA substitution and G+C content of non-coding regions.
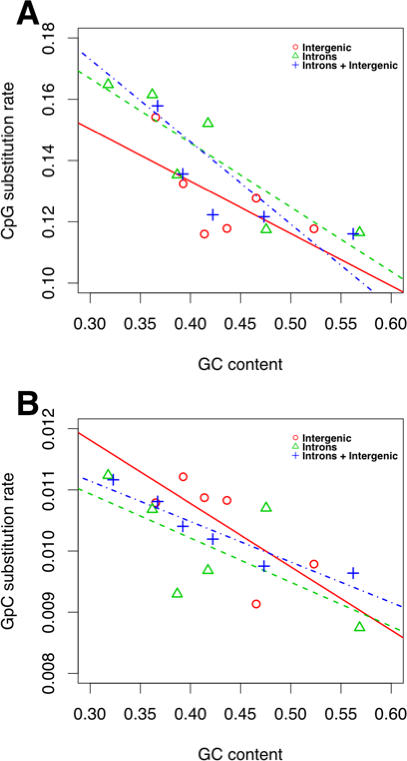
(A) Non-coding regions (intergenic and introns) were partitioned into six equal-sized bins based on their G+C contents. The rates of CG->TA substitutions in CpG sites of these bins are negatively correlated with their G+C contents. The negative relationship holds when introns were analyzed separately. In case of intergenic regions the relationship was not significant. Nevertheless, we found a negative trend. (B) GpC substitution rates in non-coding regions exhibited a negative relationship with G+C contents. When divided into intergenic regions and introns, however, the relationships were not significant, although there was a clear negative trend. Refer text for r2 values and P- values.