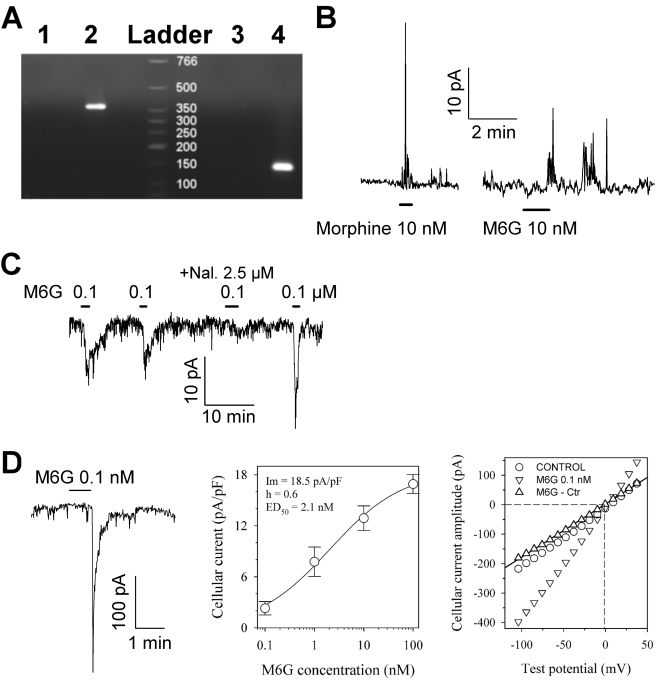
Figure 5. Amplification of MOR1 RNA and characterization of the electrophysiological effects of a low concentration of morphine and M6G.
A. Total SH-SY5Y RNA was submitted to RT-PCR using specific human MOR1 primers. Lane 1, control using water as a PCR template to test for contamination. Lane 2, total RNA from SH-SY5Y, showing a single band of 376 bp. Lane 3, negative control of GAPDH amplification (water). Lane 4, SH-SY5Y total RNA (GAPDH, 142 bp). Size standards are indicated in bp. B and C. Typical responses of SH-SY5Y cells to low concentrations of morphine and M6G antagonized by naloxone, as measured by the patch clamp technique in cell-attached mode at a pipette potential of 60 mV and 80 mV (B panel), as well as at −135 mV (C panel). M6G was repeatedly applied in the absence or presence of naloxone (Nal.). D. Whole-cell patch clamp recording of the M6G response: the left-hand panel shows a typical trace recorded at a holding potential of −135 mV, the middle panel shows a dose-response curve obtained at a holding potential of −80 mV, and the right-hand panel shows an I-V plot of the peak amplitude response. The dose-response data were fitted with Hill's equation (continuous line) with optimal parameters as indicated in the Figure. The I-V plot of the steady state current for the control (circles) and at the peak of the response to 0.1 nM M6G (inverted triangles) was obtained using a ramp potential protocol from 80 to −140 mV lasting 800 ms. The specific current elicited in the presence of M6G (upright triangles) was linear, and the reversal potential calculated by linear regression gave a value of −0.5 mV (dashed line). Traces were filtered at 2 kHz and digitized at 5 kH. Bars indicate the period of drug application at the indicated concentrations.

