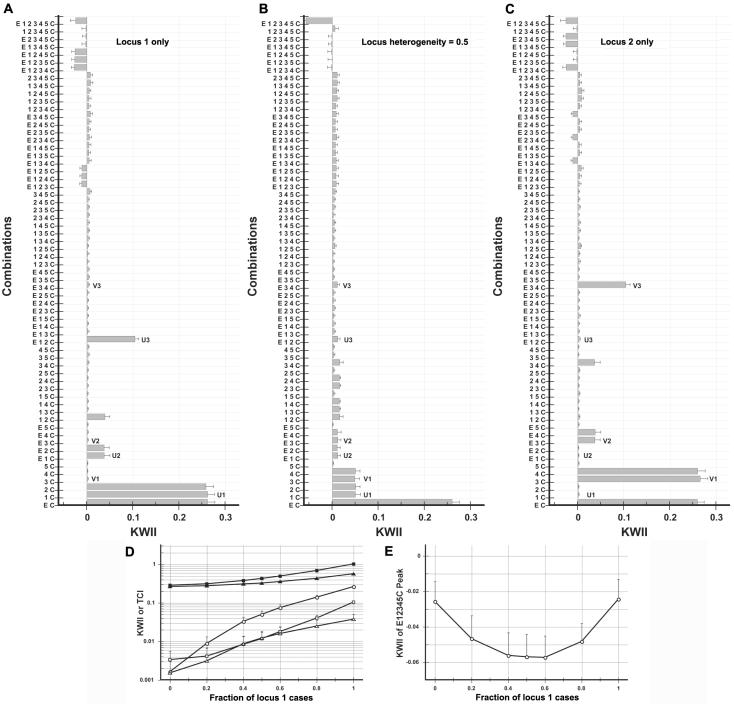
Figure 12. .
Dependence of KWII on locus heterogeneity. B, 50%-50% mixture of cases generated via interactions between the environmental variable E and SNPs 1 and 2 (locus 1 in panel A) and cases generated via interactions between the environmental variable E and SNPs 3 and 4 (locus 2 in panel C). The model in case study 2 was used. The combinations used for KWII calculations are indicated on the Y-axes. The error bars represent SDs that are due to sampling and were obtained from 100 random samples. Representative one-variable– (U1, V1), two-variable– (U2, V2), and three-variable–containing (U3, V3) peaks characteristic of locus 1 and locus 2 are highlighted. D, Dependence of KWII (unblackened symbols) and TCI (blackened symbols) for the one-variable-containing peak U1 (circles), the two-variable–containing peak U2 (triangles), and the three-variable–containing interaction peak U3 (squares) on locus heterogeneity, as assessed by the fraction of cases that are due to locus 1. E, KWII values of the {E, 1, 2, 3, 4, 5, C} combination. The error bars represent SDs.

