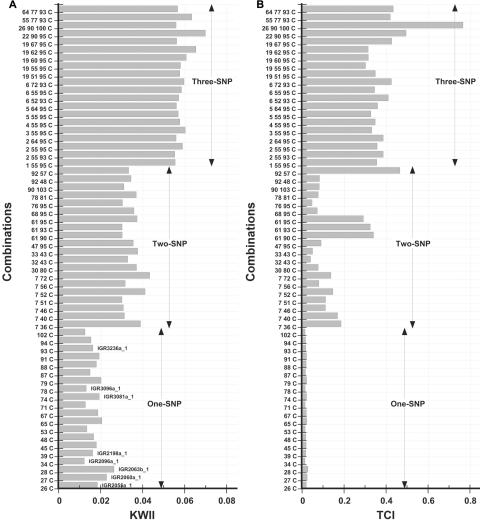
Figure 15. .
A and B, KWII and TCI values for the top 20 one-SNP, two-SNP, and three-SNP combinations with the highest KWII values for the Crohn disease phenotype in the data set of Daly et al.16 All combinations involving three or fewer SNPs were computed, and each set was sorted by KWII. The combinations are indicated on the Y-axes, and SNPs identified by Rioux et al.17 as being significantly associated are labeled.

