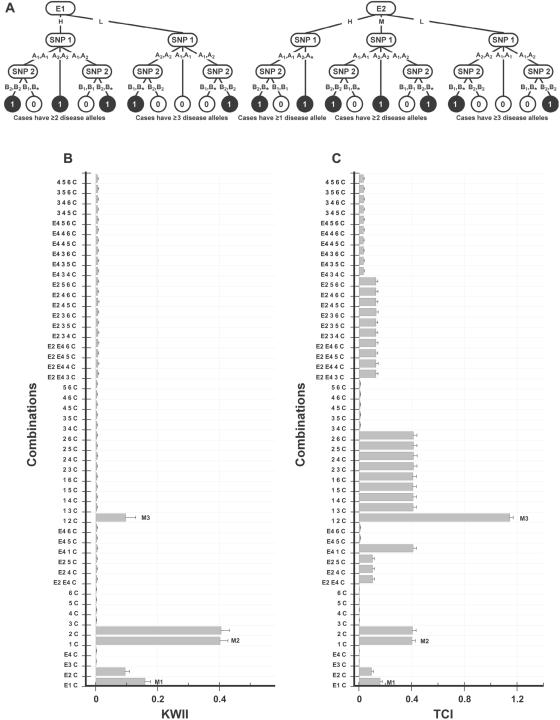
Figure 5. .
A, Interaction model used to generate the data for case study 4. The environmental variables E1 (with states H and L) and E2 (with states H, M, and L) independently interact with two-SNP variables—SNP 1 (with alleles A1 and A2) and SNP 2 (with alleles B1 and B2)—to determine the disease status (controls are indicated by 0, and cases are indicated by 1). The asterisk (*) in a genotype represents a “wild card,” indicating that either allele is allowable. B and C, Corresponding KWII and TCI spectra, respectively. All the one-variable–containing combinations and the 20 two-variable and 20 three-variable combinations with the highest KWII values are shown. The environmental variables are shown as E1, E2, E3, and E4; the SNP variables are numbered 1–6; and phenotype is indicated as C. Three representative peaks are labeled M1, M2, and M3. The combinations used for KWII and TCI calculations are indicated on the Y-axes. The error bars in panels A and B represent SDs.

