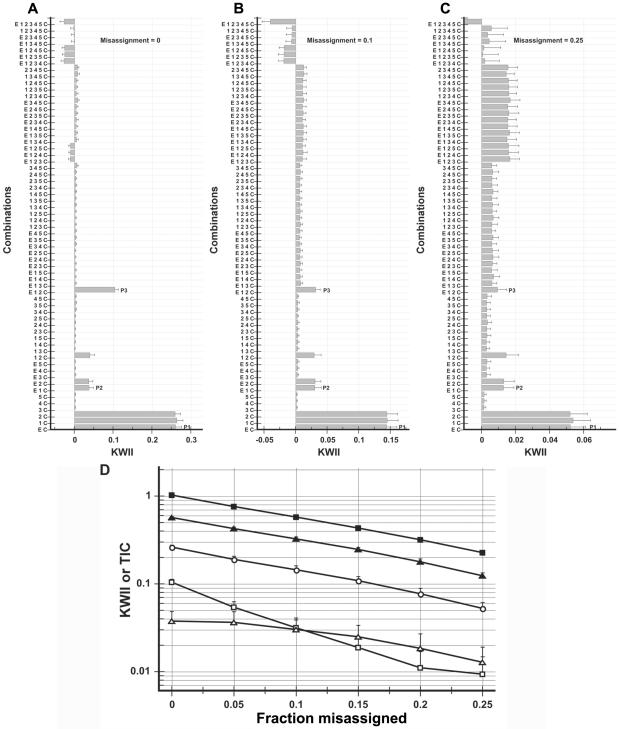
Figure 7. .
Dependence of KWII for case study 2 on fraction of controls and cases misassigned. A–C, KWII spectra for three representative misassignment levels of 0%, 10%, and 25%, respectively. The combinations used for KWII calculations are indicated on the Y-axes. D, Dependence of KWII (unblackened symbols) and TCI (blackened symbols) for the one-variable–containing peak P1 (circles), the two-variable–containing peak P2 (triangles), and the three-variable–containing interaction peak P3 (squares). The TCI for P1 is not shown because it is equal to the KWII. The error bars represent SDs.

