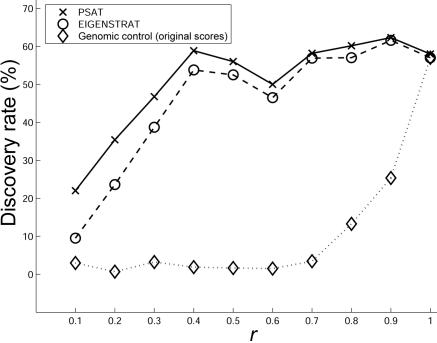
Figure 4. .
Comparison of causal SNP discovery rate when there are two causal SNPs. The data sets were composed of 1,000 cases and 1,000 controls from a mixture of CEU and ASI populations, as in figure 2. Each panel contains two hidden causal SNPs. For each algorithm, a discovery of a causal SNP was defined as the event where a SNP within 10 kb of a causal SNP was among the 100 top-ranked SNPs.

