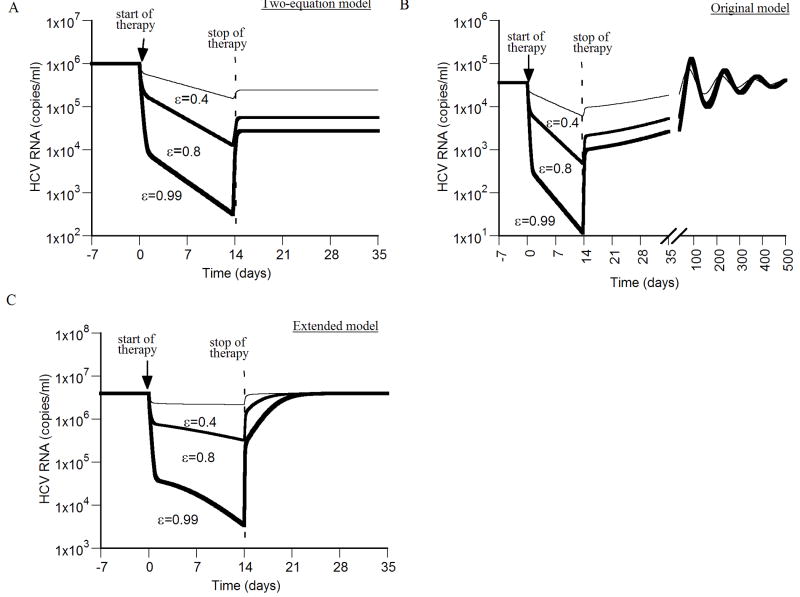
Figure 2. Viral kinetics after therapy cessation.
We simulated virus resurgence post therapy cessation using the two-equation model (A), the original model (B), and the extended model (C). Different drug efficacies (ε = 0.4, 0.8 and 0.99) were assigned at time 0 for 14 days, and then set to ε=0 for the rest of the simulation. In all simulations the following parameters were held fixed: d = 0.0026 day-1, p = 2.9 virions/day, β = 2.25×10⁻⁷ ml day-1 virions-1, c = 6.0 day-1, δ = 0.26 day-1. A) During therapy (ε > 0) the virus concentration V(t) can be calculated using Eq. (7). Here the initial condition V(0) = V0 = 106/ml was used. Upon cessation of therapy at time te = 14 days, V increases from V(te) to a new steady-state level V(te)/(1-ε), but not to its pretreatment level, as explained in section 2.1.4. B) Using the original model, with s = 2.6×10⁴ cell ml-1 day-1, the virus resurges to pretreatment levels with damped oscillations. The curve for virus increase after therapy cessation with drug efficacies of ε = 0.99 and ε = 0.8 largely superimpose. The virus resurges to pretreatment viral load levels in a significant shorter time with higher values of p and/or β (not shown). C) Using the extended model, with s = 2.6×10⁴ cell ml-1 day-1, r = 4.2 day-1 and Tmax = 1.0 × 10⁷ cells, the virus resurges to pretreatment levels within a week post therapy cessation.

