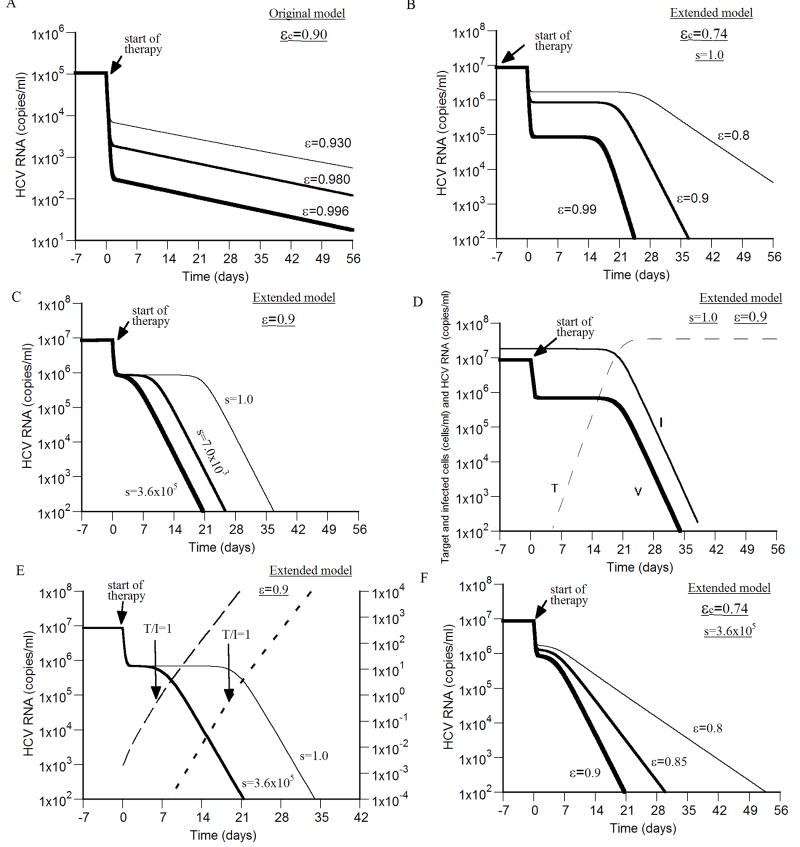
Figure 3. Viral kinetics during successful antiviral treatment.
We simulated virus decay during therapy using the original model (A), and the extended model (B - F), with different drug efficacies higher than the critical efficacy (ε > εc), and (unless otherwise stated) d = 0.01 day-1, p = 2.9 virions/day, β = 2.25×10⁻⁷ ml day-1 virions-1, δ = 1.0 day-1, c = 6.0 day-1, r = 2.0 day-1, s=1.0 cell ml-1 day-1 and Tmax = 3.6 × 10⁷ cells ml-1. A) With drug efficacies (i.e., ε = 0.93, 0.98 and 0.996) higher than the critical efficacy (εc=0.90), a biphasic viral decline is shown which lead to viral eradication. Based on simulation results, the second phase viral decline slopes under the three efficacies (i.e., ε=0.93, 0.98 and 0.996) are 0.047 day-1, 0.050 day-1 and 0.051 day-1, respectively (i.e., 91%, 98% and 99% of the death rate of infected cells used here (δ = 0.052 day-1). Tmax = 1.0 × 10⁷ cells ml-1, s=2.6×10⁴ cell ml-1 day-1 and d = 0.0026 day-1. B) With drug efficacies (i.e., ε = 0.80, 0.90 and 0.99) higher than the critical efficacy (εc=0.74), a triphasic viral decay is shown that consists of a first phase with rapid virus decline followed by a “shoulder phase” in which virus load remains constant and a third phase of faster viral decay. For the three efficacies 0.80, 0.90 and 0.99 the third phase viral decline slopes are 0.04 day-1, 0.34 day-1 and 0.82 day-1, respectively, i.e., 4%, 34% and 82% of the infected cell death rate used here (δ=1.0 day-1). C) Higher influx rates of new hepatocytes, s, shrinks the “shoulder phase” and even eliminates it giving rise to a biphasic viral decline. The drug efficacy was fixed, ε=0.90, in the three simulation curves. Note, over a large range of values for s, i.e., 1.0×10⁵ - 3.6×10⁵ cells ml-1 day-1, with the above parameter values, the critical drug efficacy εc = 0.742 − 0.743, and thus does not change significantly. D) The viral (thick line) shoulder phase is maintained by a quasi-steady-state level of infected cells (thin line) until the target cell population level (dashed line) reaches that of infected cell population. E) A shoulder phase is observed when the level of infected cells is much higher than the target cell level at baseline (i.e., T/I ≪ 1 before therapy; (short-dashed line)). The shoulder phase ends when T/I ~ 1. T/I ratio for the shorter shoulder-phase is represented by a long-dashed line. F) With a higher influx rate of new hepatocytes, s = 3.6×10⁵ cell ml-1 day-1, and drug efficacies ε = 0.80, 0.85 and 0.90, higher than the critical efficacy (εc=0.74), a biphasic viral decay is shown that leads to viral eradication. The second phase viral decline slopes for the three efficacies ε = 0.80, 0.85 and 0.90 are 0.20 day-1, 0.38 day-1 and 0.57 day-1, respectively, i.e., 20%, 38% and 57% of the infected cell death rate used here (δ=1.0 day-1).

