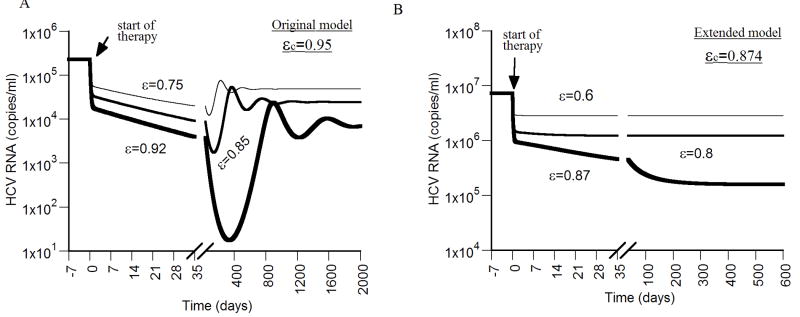
Figure 4. Viral kinetics with drug efficacy below the critical efficacy.
We simulated virus decay during therapy using the original model (A), and the extended model (B), with different drug efficacies below the critical efficacy (ε < εc), and η = 0, d = 0.0026 day-1, p = 2.9 virions/day, β = 2.25×10⁻⁷ ml day-1 virions-1, and c = 6.0 day-1. The critical efficacies for the original model and the extended model were calculated using Eqs. (17) and (29), respectively. With the original model, (A), after an initial rapid viral decrease upon start of therapy, the virus decays in a slower second phase during the first weeks of therapy until it reaches a viral nadir and then rebounds to a lower viral plateau. Higher values of p and/or β lead to shorter times until the lower plateau is reached (not shown). In (A), δ = 0.052 day-1 and s = 2.6×10⁴ cell ml-1 day-1. With the extended model (B), after a rapid viral decrease upon start of therapy, the virus decays in a slower phase during the first weeks of therapy until it reaches a lower viral plateau. A lower value of r, e.g.,<0.05 day-1, leads to viral oscillation, until it reaches the lower viral plateau (not shown). δ = 0.26 day-1, Tmax = 1.0×10⁷ cells, s = 2.6×10⁵ cell ml-1 day-1 and r = 1.0 day-1.

