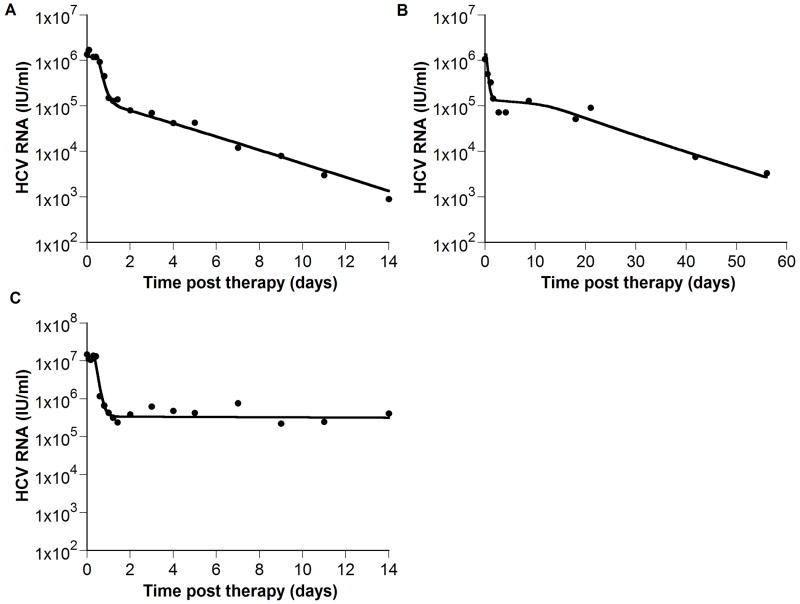
Figure 5. The model is consistent with experimental data.
(●) exhibiting biphasic (A), triphasic (B) and flat partial (C) viral decays. We fit (A) HCV RNA levels from a chronic HCV patient treated with interferon α-2b from Neumann et al., 1998, (B) digitized HCV RNA levels of a patient treated with pegylated interferon α-2a (shown in figure 2B of Hermann et al., 2003), and (C) HCV RNA levels from a second patient treated with interferon α-2b from Neumann et al., 1998. The analytical solution for V(t), i.e., Eq. (7) in Neumann et al., 1998 was first fitted to the HCV RNA, using Berkeley-Madonna (version 7.0.2; www.berkeleymadonna.com), to estimate the delay time before viral decay begins, t0, the IFN effectiveness, ε, and the viral clearance rate constant, c. Then, we fitted our model (Eqs. 24 - 26; solid line) to the HCV RNA data (●) with t0, ε, and c held fixed at their previously estimated values, and found values for the parameters s, d, δ, p, r, Tmax, and β for each patient that generated viral load decays consistent with the data. Parameter values found in (A), (B) and (C) respectively are: Tmax = 0.7 × 10⁷, 0.51 × 10⁷ and 0.6 × 10⁷ ml-1; s = 8.0 × 10⁵, 1.5 × 10³ and 3.7 × 10⁴ day-1 ml-1; d = 4.7 × 10⁻³, 9.3 × 10⁻³ and 2.4 × 10⁻³ day-1; δ = 0.30, 0.49 and 0.06 day-1; β = 0.6 × 10⁻⁷, 3.8 × 10⁻⁷ and 1.8 × 10⁻⁷ virions-1 day-1; r = 0.45, 0.54, and 0.73 day-1; c = 5.9, 3.5, and 13.9 day-1; t0 = 0.6, 0.3, and 0.4 days; p = 5.4, 7.1 and 13.9 virions day-1; ε = 0.906, 0.899 and 0.9675.

