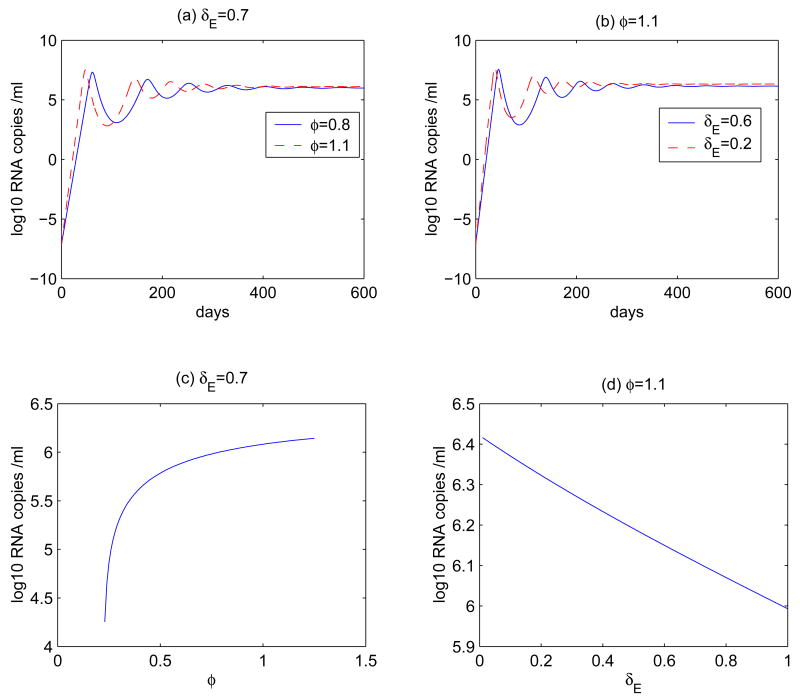
Figure 2.
Time plots for the virus dynamics of model (1) for different φ or for different δE. (a) φ = 0.8 or 1.1 day−1, δE = 0.7 day−1. (b) δE = 0.2 or 0.6 day−1, φ = 1.1 day−1. The values of other parameters are the same as those in Figure 1. The initial values for T, , T* and V are 106 ml−1 [40], 0, 0, and 10−6 ml−1 [55], respectively. The steady state of the viral load is plotted as a function of φ or δE in (c) and (d). When φ < 0.23, the virus population dies out.

