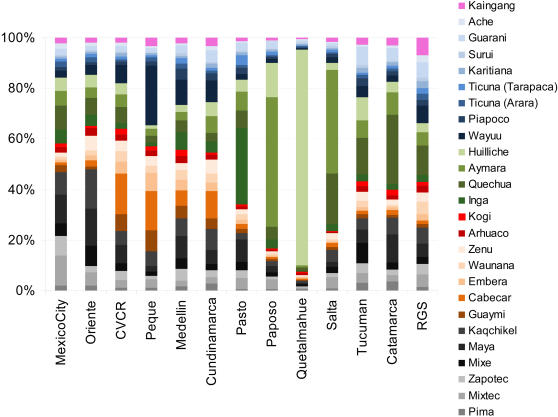
Figure 6. Regional Native American Ancestry of 13 Mestizo Populations Considering each Individual Native Population.
The relative partitioning of the Native American component is shown as the proportion of the colored bar (the European and African components are not shown). These are coded in shades of a color corresponding to the main linguistic stocks shown in panel Figure 1 and Figure 5.

