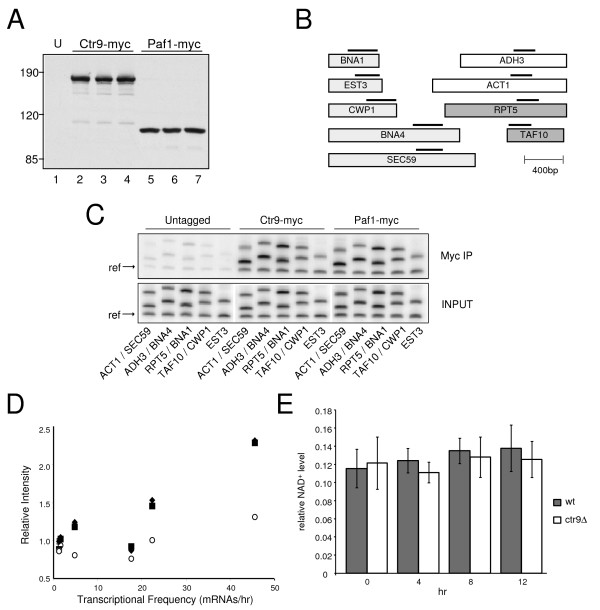
Figure 1.
Gene occupancy by Ctr9 and Paf1. (A) Expression of endogenous, c-myc-tagged Ctr9 and Paf1 proteins. Protein from three Ctr9-myc-expressing isolates (HM198), three Paf1-myc-expressing isolates (HM199) or the untagged HM177 parental strain (U) were fractionated by SDS-PAGE. Protein was detected by immunoblotting with the 9E10 antibody. (B) Locations of gene-specific PCR probes. Each ORF is represented by a box. Light gray, genes whose expression decreased upon removal of Ctr9; dark gray, genes whose expression increased; white, genes whose expression remained unchanged. The positions and relative sizes of PCR products are indicated by dark bars above. (C) Assays of gene occupancy by ChIP. Association of Ctr9 and Paf1 with the regions indicated in (B) was monitored in cells maintained in YPD medium at 30°C. Upper panel, amplification of anti-myc immunoprecipitates; lower panel, amplification of input chromatin. The middle and upper bands in each lane represent amplified segments of the ORFs indicated (middle/upper) at bottom. The lowest band in each lane is an amplified fragment from the promoter region of ARN1, which was used as an internal reference [16]. (D) Correlation of transcriptional initiation frequency with gene occupancy by Ctr9 and Paf1. The relative signal intensities for each of six gene fragments associated with Ctr9-myc and Paf1-myc are plotted as a function of their transcriptional initiation frequencies as estimated in reference [25]. Diamonds, Paf1-myc; squares, Ctr9-myc; circles, untagged control. (E) Effect of acute Ctr9 depletion on intracellular NAD+ levels. Wild-type (HM167) and ctr9Δ (HM158) strains containing the Ctr9 expression plasmid pgCTR9M2 were initially grown in SC -leu + 2% galactose. Cells were then transferred to SC -leu + 2% glucose and maintained at 30°C. Relative intracellular levels of NAD+ were measured at 0, 4, 8 and 12 hours after switch to glucose. NAD+ levels are expressed on the Y axis as absorbance at 340 nm. Values represent mean and standard deviation (n = 3).

