Figure 5.
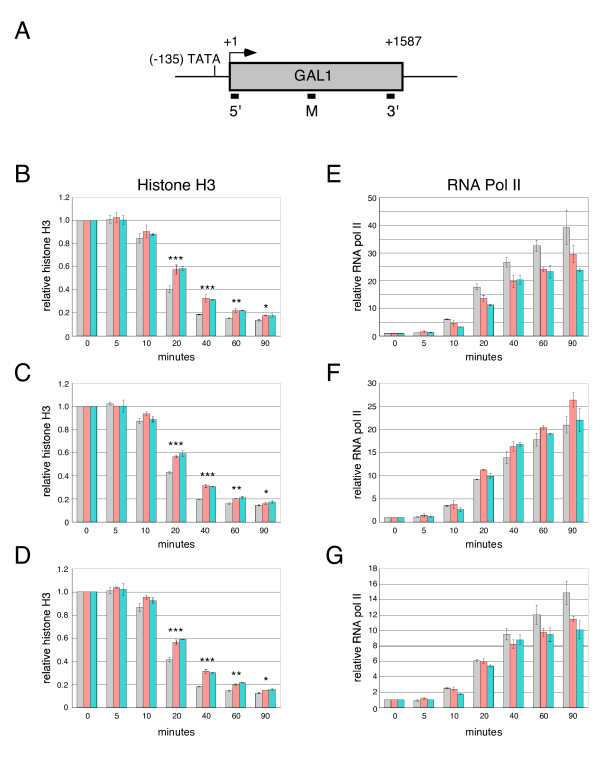
Depletion of Ctr9 or Paf1 delays removal of histone H3 and alters the distribution of RNA pol II upon induction of GAL1 transcription. (A) Schematic representation of the GAL1 locus. The TATA region, translation start site and ORF are indicated. Black bars below indicate positions of PCR probes used in ChIP assays. (B – G) Association of histone H3 (B – D) or RNA pol II (E – G) with 5' (B, E), middle (C, F) and 3' (D, G) regions of the GAL1 locus as a function of time after induction. Wild-type (HM200), ctr9Δ (HM201) and paf1Δ (HM202) strains were grown at 24°C in YEP supplemented with 2% raffinose. Galactose was added to final concentration of 2%. Samples were taken at 0, 5, 10, 20, 40, 60 and 90 min after induction. Association of histone H3 (B – D) and Rpb3 (E – G) with 5' (B, E), middle (C, F) and 3' (D, G) regions of GAL1 were assayed by ChIP and real-time PCR for wild-type (gray), ctr9Δ (peach) and paf1Δ (turquoise) strains. All samples were also assayed with primers specific for an intergenic region (B – D) or FBA1 (E – G) as standards for normalization of the GAL1-specific signals. The normalized association of H3 or Rpb3 with each region of GAL1 at 0 min was set to 1; all other values represent the fold difference relative to the 0 min sample. Each value is the average of two experiments; error bars correspond to the standard errors of the mean. Statistical significance of pairwise comparisons between wild-type and ctr9Δ or paf1Δ strains was determined using a two-tailed t-test. ***, P < 0.0005; **, P < 0.004; *, P < 0.04.

