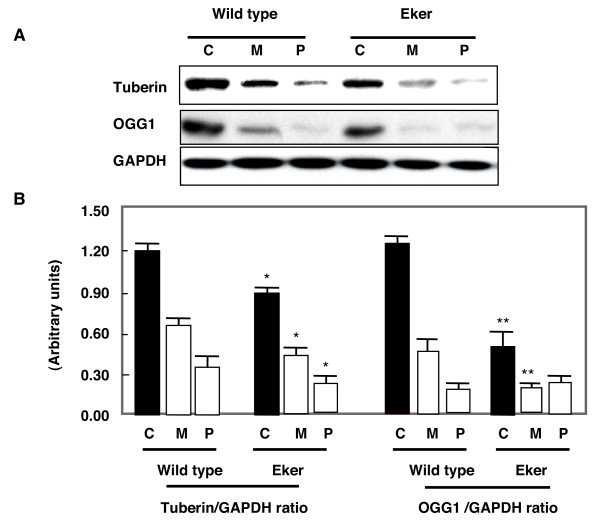
Figure 1.
Distribution of tuberin and OGG1 protein in kidney cortex (C), medulla (M) and papilla (P) of wild type and Eker rats. A. Immunoblot analysis of tuberin and OGG1 in different kidney regions. Different kidney regions were homogenized and protein extracts were loaded onto 7% SDS-polyacrylamide gels and transfered to PVDF membrane. The membrane was incubated with anti-tuberin or anti-OGG1 followed by different specific HRP-conjugated secondary antibodies. The proteins were visualized by ECL. GAPDH was used as loading control. B. Histograms represent means ± SE (n = 3). Significant difference from wild type rat is indicated by * P < 0.05 and ** P < 0.01.

