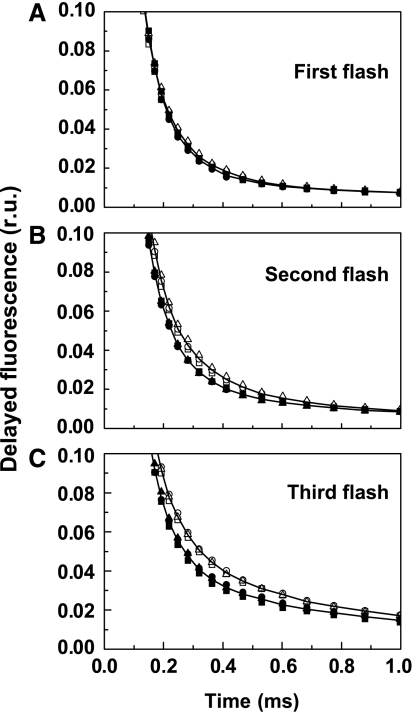
Figure 6.
Time course of DF for the first three flashes (A–C) applied to dark-adapted PSII(Cah3−) isolated from the cia3 mutant in Ci-free SMS buffer. Open symbols, without additions; filled symbols, in the presence of 1 mM KHCO3. The figure shows three independent replicates for each treatment and the lines are the best-fit curves for each group of three replicates within a treatment. All curves are normalized at 10 μs.

