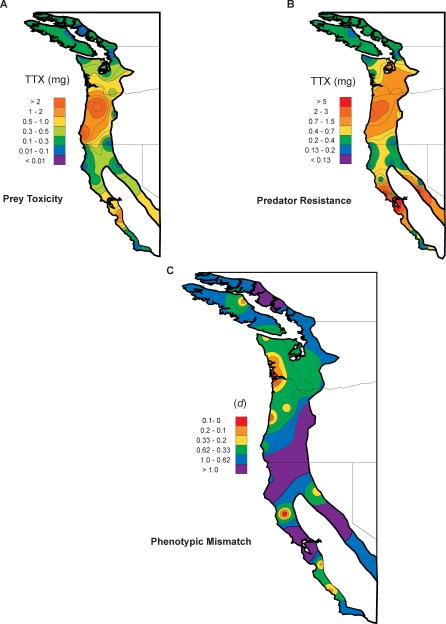
Figure 2. The Interpolated Geographic Distribution of Phenotypes and Phenotypic matching for Newts and Snakes in Western North America.
The interpolated geographic distribution of (A) prey toxicity, (B) predator resistance, and (C) the degree of phenotypic matching of these traits shown as isocline maps across the geographic range of sympatry in western North America.
(A) Toxicity of prey shown as the total amount of tetrodotoxin (TTX) (mg) expected in the skin of an average adult animal based on the toxicity of 28 populations of Taricha newts in Figure 1.
(B) Predator resistance shown as the amount of TTX (mg) required to reduce an average adult female T. sirtalis to 50% of its baseline performance based on the 28 populations in Figure 1.
(C) The degree of phenotypic matching plotted as d, which measures the deviation from estimated match, at each locality, of the phenotypic interface of coevolution (i.e.. TTX toxicity in newts and TTX resistance of co-occurring snakes). Note that general overall patterns of relative phenotype exaggeration (yellow, orange, and red in (A) and (B)) are generally similar for newts and snakes throughout their range of sympatry. The matching analysis (Figure 3, Figure 4) and (C) shows that similarly elevated phenotypes do not necessarily match functionally.

