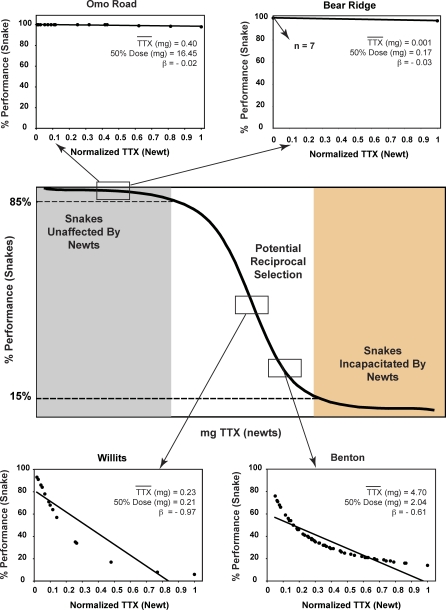
Figure 4. Representative Interaction Gradients for Localities across the Range of Mismatches.
The solid line s-shaped curve is the generalized dose response curve relating whole-snake resistance in snakes to quantity of TTX in mg. The position of this curve on the x-axis (TTX level) varies among localities (thus the lack of scale). The shaded regions correspond to the zones of mismatch evaluated based on phenotypic distributions of predator and prey phenotypes. From each zone (no localities were observed occupying the orange region), interaction gradients are shown for two example localities varying in newt toxicity. Interaction gradients are the linear regression of expected snake performance on individual whole-newt toxicities for a given locality, the slope (β) of which quantifies average potential selection due to the phenotypic interface. Zero or near-zero slope gradients indicate the absence of variance in fitness outcomes and therefore a lack of reciprocal selection. Zero slope localities illustrated include one with very low TTX (Bear Ridge, California), and one with intermediate TTX levels (Omo Road, California). Positive slope localities include one with intermediate (Willits, California) and one with very high TTX levels (Benton, Oregon). The full complement of interaction gradients can be found in Figure S1 and are summarized in Table S1.

