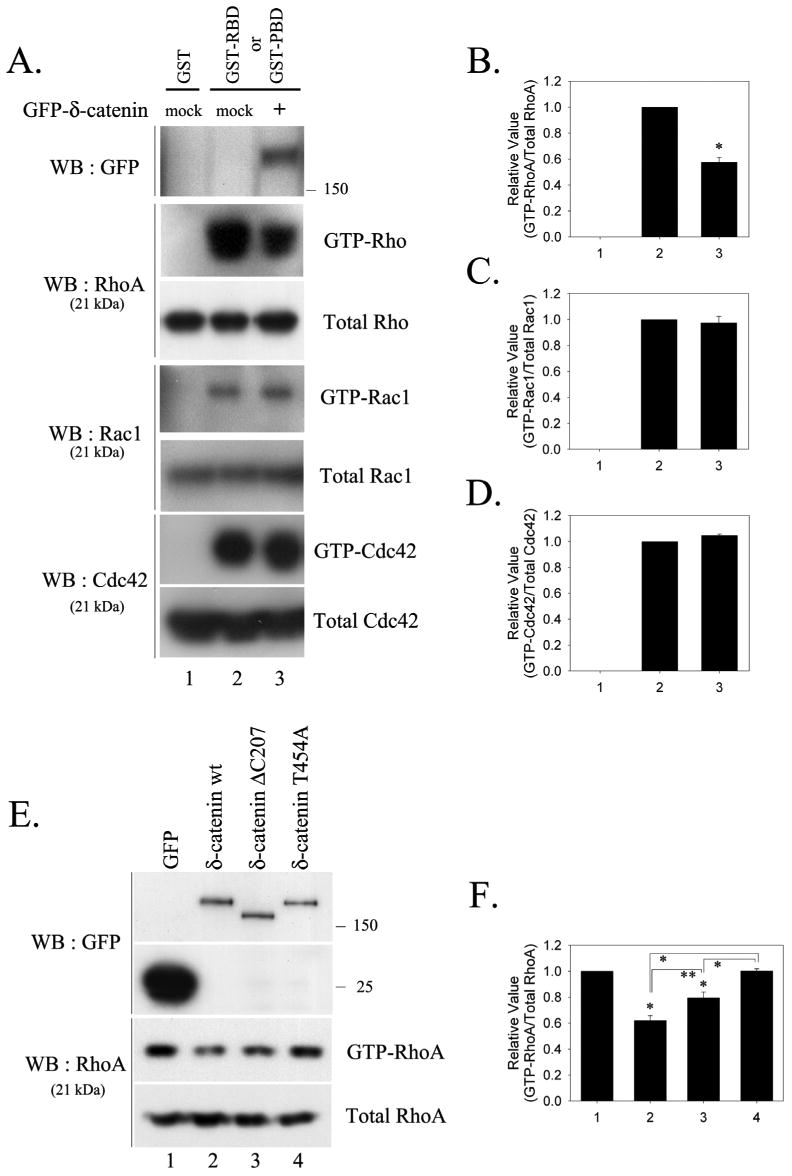
Fig. 3. Overexpression of δ-catenin results in a decrease in the level of GTP-RhoA, while the Rac1 and Cdc42 activity are unaffected.

(A) The levels of active GTP-bound RhoA, Rac1 and Cdc42 were measured in MEF cells transfected with either the mock or GFP-δ-catenin. The RhoA activity was measured using a GST-RBD, and the Rac1, Cdc42 activities were measured using a GST-PBD. The total amounts of RhoA, Rac1, and Cdc42 are also shown to compare the endogenous level of each GTPase in the transfected cells. The relative activity of RhoA (B), Rac1 (C), and Cdc42 (D) were determined as described in Materials and Methods. The data is represented as the mean ± SEM (* p<0.01). (E) The level of active GTP-bound RhoA was measured in the MEF cells transfected with GFP or with wt/mutant GFP-δ-catenin constructs using GST-RBD. (F) The relative activity of RhoA was determined. The data is represented as the mean ± SEM (* p<0.01, ** p<0.05). Results are representative of at least three independent experiments.
