
Figure 4.
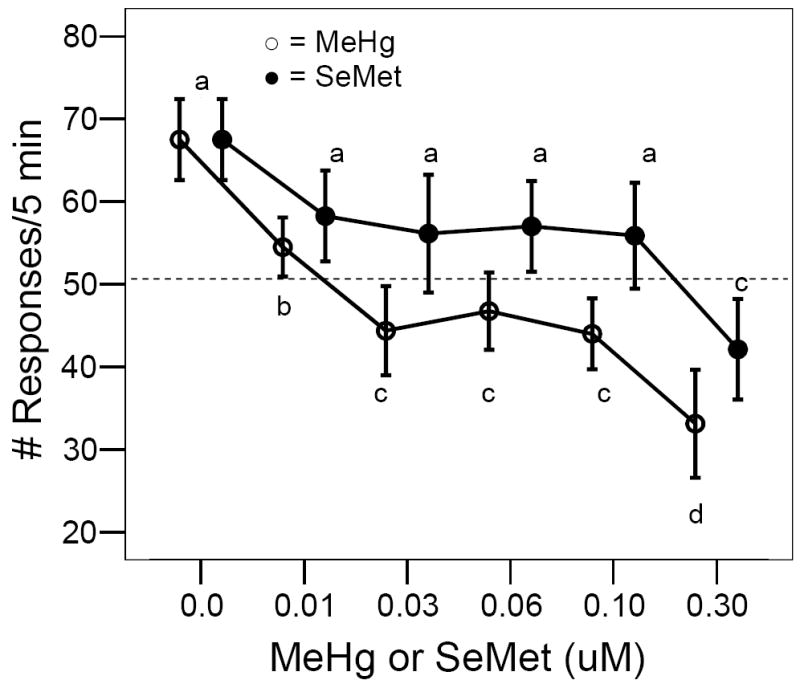
Effect of developmental MeHg (○) or SeMet (●) exposure on adult expression of visual responses to a rotating black bar under low light conditions. Horizontal line represents the expected number of responses if a stationary fish reacted once each time the black bar completed a circuit around the glass holding dish, i.e., 10 revolutions/min for 5 min = 50 responses. Bars with different letters (a = not different from control values) are statistically different from their respective control (ANOVA, P< 0.05, Tukey’s HSD Test, P < 0.05).