
Figure 3.
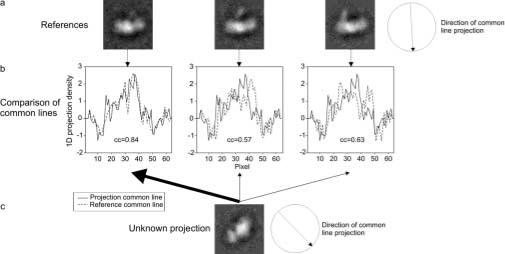
Cross-correlation of common lines to distinguish conformational states. a. Reference projections. All candidate projections will be designated as corresponding to one of the three conformations based on the highest cross-correlation of common lines with these references. b. Cross-correlation of common lines (CCCL), between each of the reference projections and the candidate, for the maximum CCCL within the known 15° angular range. c. Candidate projection, designated as being in the same conformational state as reference 1, due to its highest cross-correlation of common lines.