
Figure 5.
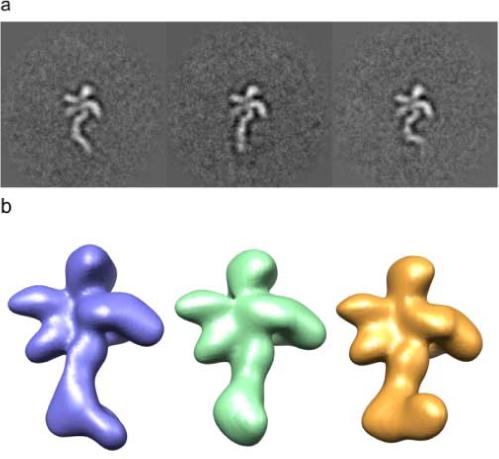
Model data assignment results. a, graph showing the percentage accuracy of assignment within each classified group across various noise levels. b, graph showing the value of the maximum CCCL and success of assignment in relation to the distance between the Euler angles of the reference and the assigned view.