
Figure 1.
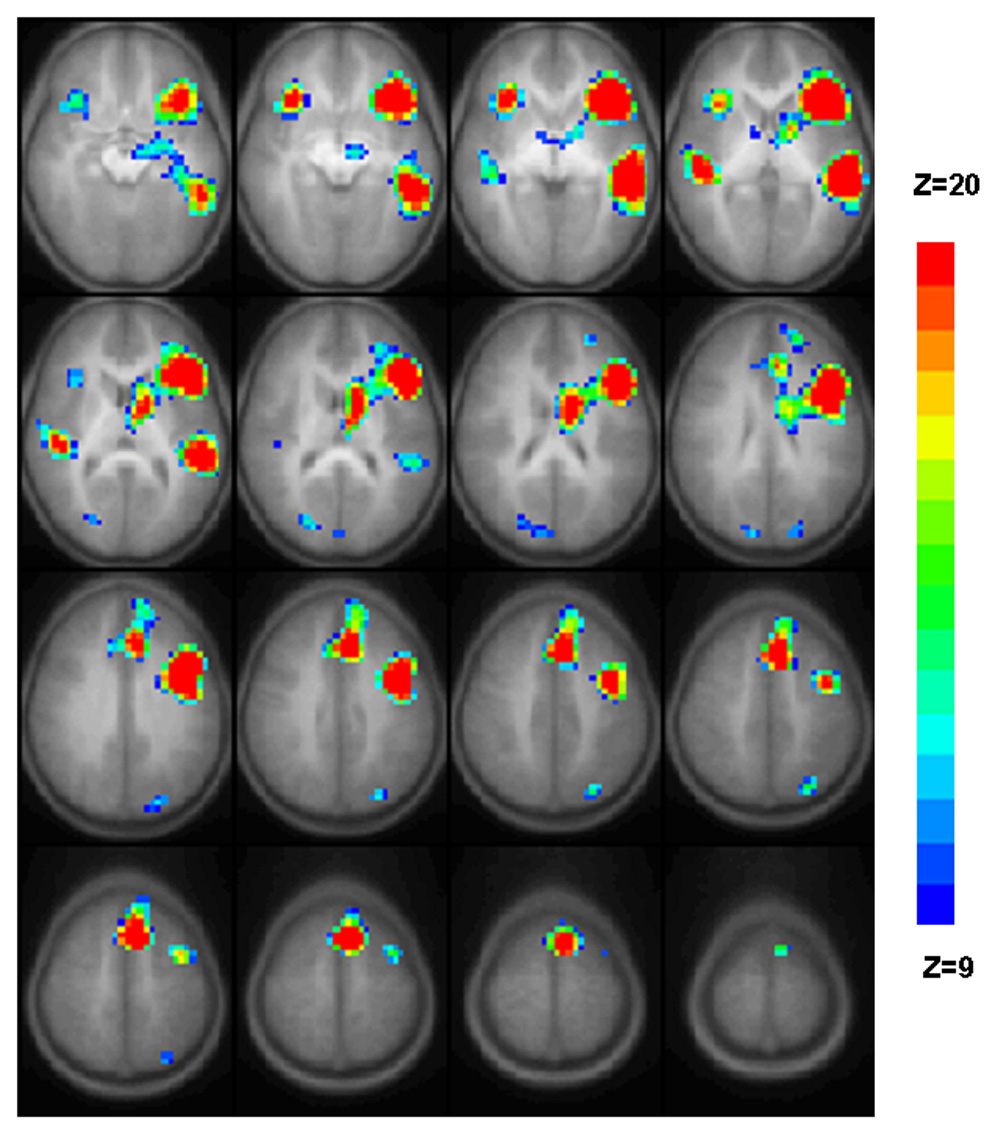
Regions with significant activation in response to the verb generation task for healthy children enrolled in this study. GLM composite map presented in radiological convention (left on the picture corresponds to the right hemisphere) incorporates all 29 subjects and all annual visits for which useable data points were obtained. Activated voxels have nominal Z = 9 (blue) to Z = 20 (red) are superimposed on average T1-weighted image generated from all T1-weighted images from all subjects/all sessions. All regions are significant with p < 0.05 corrected for multiple voxel comparisons. 16 axial slices selected for display (slice range in Talairach coordinates: z = −10 to + 65 mm). For exact location of the BOLD signal changes see Table 2.