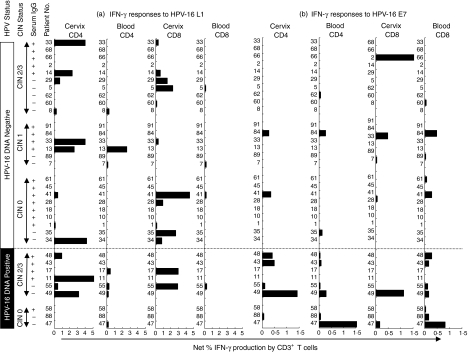
Figure 2.
HPV-16 (a) L1- and (b) E7-specific IFN-γ production by CD4+ and CD8+ T cells from all donors following direct ex vivo stimulation. Individual donors have been grouped according to whether they were (i) actively infected with HPV-16 (DNA Positive; bottom panel) or (ii) were negative for HPV-16 DNA (top panel). Within each of these groups, individual donors have been grouped according to CIN status and serum IgG status. Each bar represents an individual's net percentage IFN-γ production by either CD4+ or CD8+ CD3+ T cells. Net percentage IFN-γ responses were calculated by subtracting background percentage IFN-γ production by unstimulated cells.

