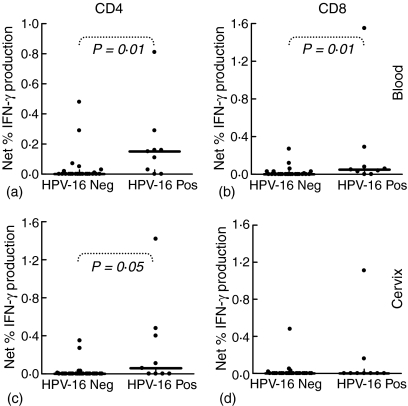
Figure 3.
Impact of current HPV-16 infection at the cervix on inflammatory T cell responses to HPV-16 E7. Blood (a, b) and cervical (c, d) CD4+ and CD8+ T cell IFN-γ production following stimulation with HPV-16 E7 in women either having no HPV-16 DNA at the cervix (HPV-16 Neg) or with active HPV-16 infection (HPV-16 DNA Pos). Each (?) represents an individual's net percentage IFN-γ production by either CD4+ or CD8+ T cells. Net percentage IFN-γ responses were calculated by subtracting background percentage IFN-γ production by unstimulated cells. The solid lines indicate median response indices for each group. P-values were calculated using the Mann–Whitney U-test (Statistica®) and P-values = 0·05 were considered significant.

