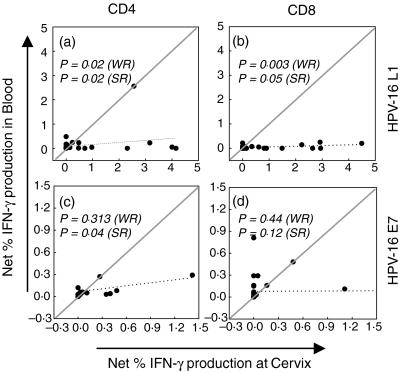
Figure 4.
Correlation of cervical and blood CD4+ (a and c) and CD8+ (b and d) HPV-16 L1 and E7 specific T-cell response magnitudes. Each (•) represents an individual's net percentage IFN-γ production by either CD4+ or CD8+ T cells. Net percentage IFN-γ responses were calculated by subtracting background percentage IFN-γ production by unstimulated cells. The dotted line indicates the linear regression. The solid line has a slope = 1 and y-intercept = 0. To test for differences in response magnitudes between compartments, Wilcoxon rank (WR) tests for paired non-parametric data was used and these P-values have been suffixed with (WR). To test for correlation between compartments, the Spearman rank (SR) test was used and significant P-values have been suffixed with (SR). P-values = 0·05 were considered significant and appear in bold text.

