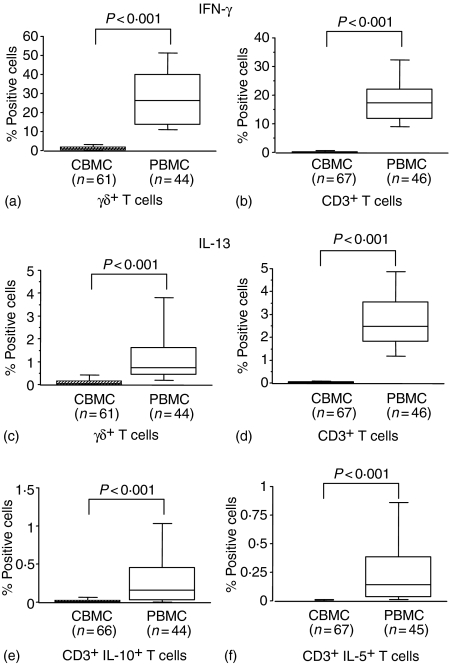
Figure 2.
The percentages of IFN-γ- (a, b), IL13- (c, d), IL-10- (e) and IL-5-containing (f) CBMC and maternal PBMC detected by flow cytometry after stimulation with PMA/ionomycin for 4 hr in the presence of brefeldin A, followed by fixation, surface and intracellular staining and gating on CD3+ TCRγδ+ cells (a, c) or on CD3+ cells (b, d, e, f). Box-whisker plots show medians of percentages with 25th and 75th percentiles in boxes and 10th/90th percentiles as whiskers. P-values refer to significance of differences between percentages considered as continuous variables and compared between groups using the non-parametric Mann–Whitney U-test.

