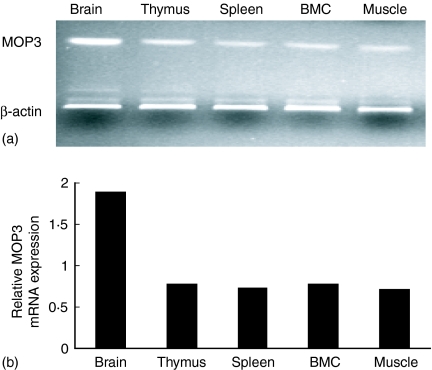
Figure 1.
The expressions of MOP3 mRNAs in the immune system. The mRNA levels in B6 mouse primary and secondary immune tissues were determined by RT–PCR as described in Materials and methods. (a) One representative of the expression of MOP3 mRNA in brain, thymus, spleen, bone marrow and muscle was shown. (b) The quantification of the MOP3 mRNA expression in mouse brain, thymus, spleen, bone marrow and muscle. The ratio of the OD value of MOP mRNA product to its internal standard β-actin was calculated. Data are one representative of two independent experiments, with similar results.

