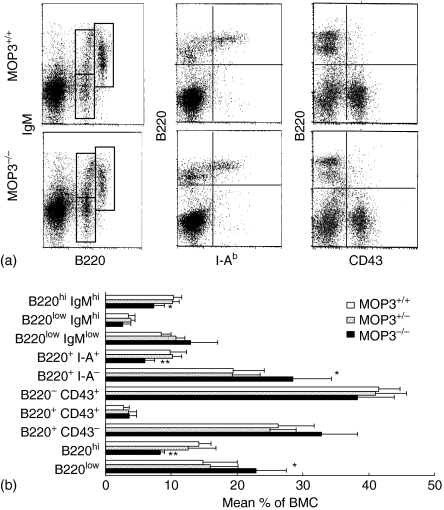
Figure 7.
The levels of developing B cells in MOP3+/+, MOP3+/– and MOP3–/– mice. (a) One representative of B cell staining detected by two-colour FCM was shown. (b) The mean percentages of B-cell subpopulations in spleens of MOP3+/+, MOP3+/– and MOP3–/– mice. Data were presented as mean ± SD. *P < 0·05, **P < 0·01, ***P < 0·001 compared with either age-matched MOP3+/+ or MOP3+/– mice. A summary of three independent experiments were shown. More than nine mice were used in each group.

