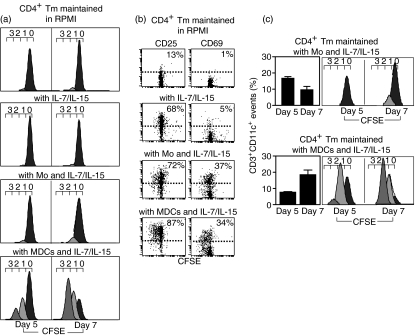
Figure 2.
The dynamics of CD4+ T memory (Tm) cell proliferation defined by the carboxyfluorescein diacetate succinimidyl ester (CFSE) division-tracking assay. CFSE-labelled CD4+ Tm cells were cultured either in the absence or in the presence of interleukin (IL)-7/IL-15 alone, or combined with monocytes or myeloid dendritic cells (MDCs), for 5–7 days. (a) Cultured cells were labelled with anti-CD3-phycoerythrin (PE), anti-CD11c-allophycocyanin and anti-CD45-peridinin-chorophyll-protein (PerCp) monoclonal antibodies (mAbs) and analysed by flow cytometry. Regions R1 and R2 were created to define live CD45+ cells and CD3+ T cells (see Fig. 1). Histograms show the fluorescence profile of CFSE-labelled CD3+ T cells (corresponding to CD4+ Tm cells). The numbers (0–3) above the histograms denote division number, with undivided CFSE-labelled CD4+ Tm cells residing under peak ‘0’ and proliferating CD4+ Tm cells exhibiting serial halving of CFSE fluorescence residing under peaks ‘1–3’. Division peaks were determined using standard CellQuest acquisition/analysis and ModFitLT software. (b) Cultured cells were labelled with anti-CD11c-allophycocyanin and anti-CD45-PerCp mAbs combined with either anti-CD25-PE or anti-CD69-PE mAb and analysed by flow cytometry. Dot plots display CD25 or CD69 expression as a function of division of CFSE-labelled CD4+ Tm cells, with the percentages of CD4+ CD25+ Tm or CD4+ CD69+ Tm cells indicated in each dot plot (events above dashed line; dashed line shows staining with control mAb). (c) Cultured cells were labelled with anti-CD3-PE, anti-CD11c-allophycocyanin and anti-CD45-PerCp mAbs and analysed by flow cytometry. Aggregates between monocytes or MDCs and CFSE-labelled CD4+ Tm cells (determined as CD3+ CD11c+ events) were expressed as a proportion of total CD3+ Tm cells [bar; mean ± standard error of the mean (SEM) for three separate experiments]. Histograms show the CFSE fluorescence profiles of CD4+ Tm cell/monocyte or CD4+ Tm cell/MDC aggregates. Mo, monocytes.

