Figure 4.
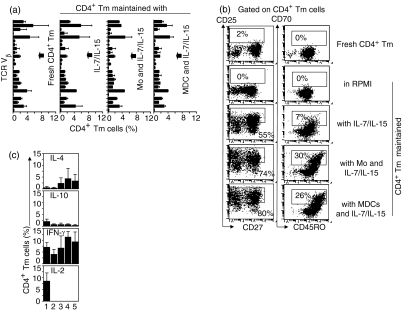
T-cell receptor (TCR) Vβ usage, surface phenotype and cytokine expression in CD4+ T memory (Tm) cells maintained with interleukin (IL)-7/IL-15 alone or with monocytes or myeloid dendritic cells (MDCs) and IL-7/IL-15. Fresh CD4+ Tm cells or CD4+ Tm cells cultured in the presence of IL-7/IL-15 alone or combined with monocytes or MDCs for 7 days were analysed for TCR Vβ usage, surface phenotype and cytokine expression by flow cytometry. (a) Fresh or cultured cells were labelled with anti-CD3-allophycocyanin and anti-TCR Vβ Repertoire Kit monoclonal antibodies (mAbs). The proportion of CD3+ T cells (corresponding to CD4+ Tm cells) expressing specific TCR Vβ (y-axis, top to bottom: Vβ-1, -2, -3, -4, -5·1, -5·2, -5·3, -7·1, -7·2, -8, -9, -11, -12, -13·1, -13·2, -13·6, -14, -16, -17, -18, -20, -21·3, -22 and -23) is shown [bar; mean ± standard error of the mean (SEM) for two separate experiments]. (b) Fresh or cultured cells were labelled with anti-CD4-peridinin-chorophyll-protein (PerCp), anti-CD25-fluorescein isothiocyanate (FITC) and anti-CD27-phycoerythrin (PE) mAbs or alternatively with anti-CD70-FITC and anti-CD45RO-PE mAbs. CD4+ Tm cells are displayed in a dot plot of CD27 versus CD25 or in a dot plot of CD45RO versus CD70. The proportions of CD4+ CD25+ and CD4+ CD70+ CD45RO+ cells are indicated (numbers in boxes). Data are from one representative experiment of five. (c) Fresh or cultured cells were labelled with anti-CD3-FITC combined with anti-IL-4-PE, anti-IL-10-PE, anti-interferon (IFN)-γ-PE or anti-IL-2-PE mAb and analysed for intracellular cytokine expression by flow cytometry. The proportion of CD3+ Tm cells (corresponding to CD4+ Tm cells) expressing IL-4, IL-10, IFN-γ or IL-2 is shown (bar; mean ± SEM for three separate experiments). (1) Fresh CD4+ Tm cells; (2–5) CD4+ Tm cells maintained (2) in RPMI; (3) with IL-7/IL-15; (4) with monocytes and IL-7/IL-15; (5) with MDCs and IL-7/IL-15. Mo, monocytes.

