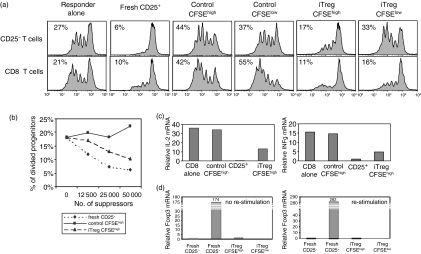
Figure 3.
CFSEhigh iTreg inhibit the responses of CD4 and CD8 T cells. (a) CFSEhigh iTreg, CFSElow iTreg or freshly isolated CD4+ CD25+ T cells (5 × 10⁴/well) were cocultured with CFSE-labeled CD4+ CD25– or CD8+ T cells (2·5 × 104/well) and stimulated with anti-CD3 (0·5 μg/ml) and TdS. Proliferation of responder cells was measured by CFSE dilution at 66 hr. (b) CFSE dilution is represented as percentage of divided progenitors when the indicated numbers of Tregs are added to the coculture. The percentage of divided responder cells among the initial progenitors was calculated using flowjo software. (c) CD8+ T cells were cocultured with CFSEhigh iTreg or control cells for 24 hr. CD8+ T responder cells were separated from the coculture and quantitative PCR for IL-2 mRNA and IFN-γ mRNA was performed (d). CFSEhigh and CFSElow iTreg were left unstimulated or were restimulated with anti-CD3 and TdS. Quantitative PCR for Foxp3 was performed. Samples were normalized to 18S rRNA and a relative value of 1·0 was given to unstimulated CD8+ or CD4+ CD25– T cells. The results are representative of at least three independent experiments.

