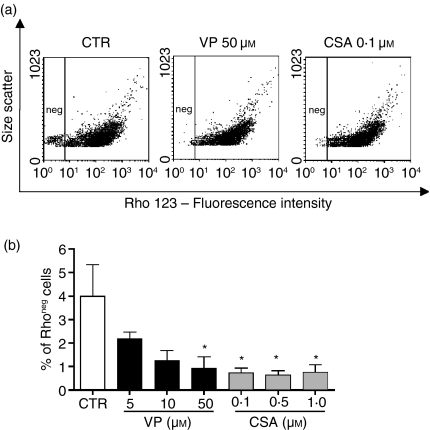
Figure 2.
Pgp-related transport activity in murine bone marrow mononuclear cells. (a) Representative dotplots showing the amount of Rho 123 negative cells (left hand side region). (b) Dose-response curve of Pgp inhibitors: VP (verapamil) and CSA (cyclosporin A). Results are expressed as mean ± SD of 3 independent experiments. *Significantly different from control P < 0·05.

