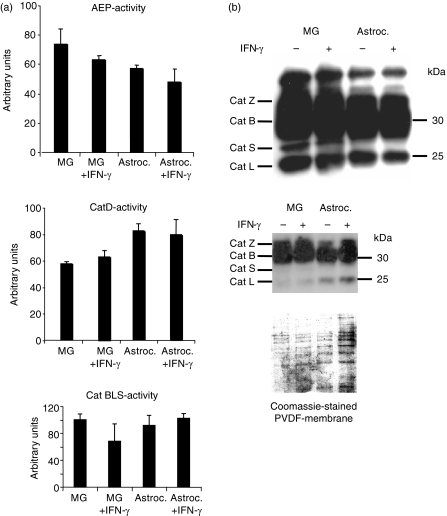
Figure 3.
Effect of IFN-γ on cathepsin and AEP activity in microglia-derived lysosomes. (a) Lysosomal extracts from resting versus IFN-γ-stimulated microglia (MG) were assessed for activity of AEP (upper panel) by turnover of the fluorogenic substrate Z-VAN-AMC and for CatD-activity (middle panel) using AMCA-EEKPISFFRLGK(Biotin)-NH2 as a fluorogenic substrate, as described in the Materials and methods. Astrocytes (Astroc.) served as controls, AEP and CatD activities are expressed in arbitrary units. Mean values and standard deviation of triplicate samples are presented. Lower panel: the combined activity of the cathepsins CatB, CatL, CatS in resting versus IFN-γ-stimulated microglial cells (MG, MG + IFN-γ) and astrocytes (Astroc., Astroc. + IFN-γ), respectively, was compared by measuring the turnover of the fluorogenic substrate Z-FR-AMC in lysosomal extracts normalized for total protein. Results are expressed in arbitrary units, mean values and standard deviation of triplicate samples are presented. (b) Lysosomal fractions from resting versus IFN-γ-stimulated microglia and astrocytes were normalized for total protein content, labelled with the activity-based biotinylated probe DCG-O4, and resolved by SDS–PAGE, followed by semi-quantitative visualization of the active papain-like cysteine proteases by streptavidin-horseradish peroxidase blot. The identity of the activity signals was deduced from side-by-side comparison to lysosomal extracts from human B-lymphoblastoid cells and monocytes, as published. Cathepsins Z, B, S and L are visualized as active species (upper panel). Coomassie staining of a PVDF membrane (lower panel) was performed as a loading control.

