Figure 2.
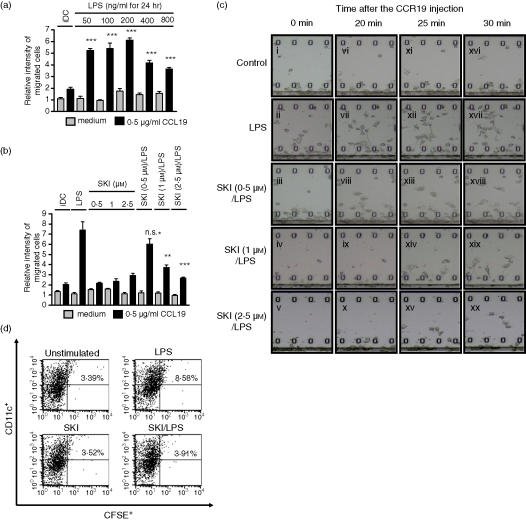
LPS-induced migration is impaired by SKI in DCs. (a) Effect of LPS on DC migration. On day 6, DCs were incubated with LPS at the indicated concentrations for 24 hr. On day 7, cells were harvested and an in vitro Boyden chamber chemotaxis assay was performed in response to medium or CCL19 (0·5 μg/ml). (b) Effect of SKI on the LPS-induced DC migration in vitro. On day 6, DCs were preincubated with SKI at the indicated concentrations for 3 hr, and were further incubated with or without LPS (200 ng/ml) for 24 hr. On day 7, cells were harvested and an in vitro Boyden chamber chemotaxis assay was performed in response to medium or CCL19 (0·5 μg/ml). (c) Time-lapse camera monitoring of chemotaxis. On day 6, DCs were preincubated with SKI (0, 0·5, 1 and 2·5 μm) at the indicated concentrations for 3 hr, and were further incubated with LPS (200 ng/ml) for 24 hr. On day 7, cells were harvested and a real-time horizontal chemotaxis assay was performed in response to medium or CCL19 (0·5 μg/ml). Migration of DCs under the gradation of CCL19 was recorded by a CCD camera. These images show portions of individual frames. (d) On day 6, DCs were preincubated with SKI (2·5 μm) for 3 hr, and were then further incubated with or without LPS (200 ng/ml) for 24 hr. A representative flow cytometry profile is shown for the groups of mice receiving unstimulated DC, LPS-DC, SKI-DC or SKI + LPS-DC. Numbers represent the percentage of CFSE+ and CD11c+ cells in the total LN DCs. The results shown are from one representative experiment of three performed (c) and (d). The asterisks in (a) indicate significant increases compared to that of the black bar of iDC at ***P < 0·001. For (b), asterisks indicate significant increases compared to the black bar of LPS-only treated DCs at **P < 0·01 and ***P < 0·001, P > 0·05 not significant (n.s.).

