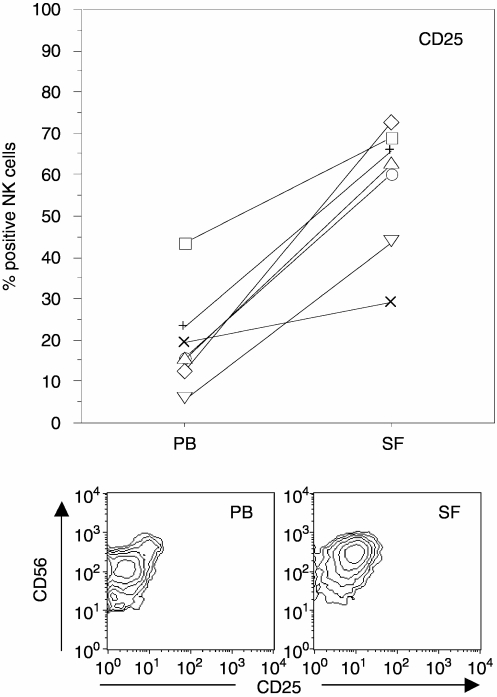
Figure 4.
Frequency of NK cells expressing CD25 in PBMC and SFMC from arthritis patients (n = 7). The lower panels illustrate CD25 and CD56 expression patterns from a representative patient. PB data are shown in the left panel and SF in the right panel. Paired comparison between PB and SF NK cells; P = 0·02. Lines connect paired samples from each patient.

