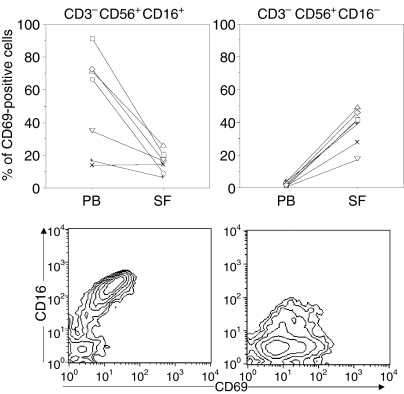
Figure 5.
CD69 expression on CD16+ and CD16– NK-cell subsets from patient PB and SF (n = 7). Lower panel shows CD16/CD69 staining patterns for one representative patient, where PB NK cells are depicted in the left panel and SF NK cells in the right panel. Paired comparison between PB and SF CD16+ NK cells; P = 0·02, and CD16– NK cells; P = 0·01. Lines connect paired samples from each patient.

