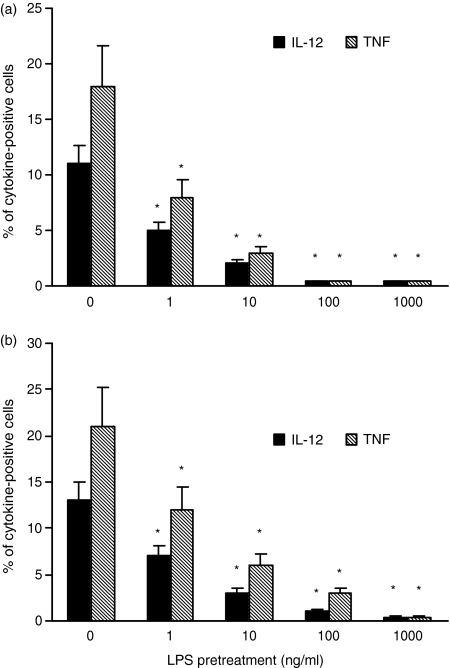
Figure 2.
Effect of LPS pretreatment on CD40L-induced intracellular cytokine production. (a) Monocytes were treated with graded doses of LPS or medium for 24 hr, washed, and then stimulated with 500 ng/ml CD40L. (b) Monocytes were cocultured, separated by a microporous membrane, with cells from the same donor pre-exposed to LPS or medium for 45 min, and then washed. After 24 hr of coculture the cells were stimulated with 500 ng/ml CD40L. Intracellular cytokine production was assessed by FACS. Less than 1% IL-12 and TNF-α production was found in mock-CD40L stimulated control samples (data not shown). The data represent the means of three experiments carried out with cells from three different donors. The error bars represent the standard errors. The asterisk indicates P < 0·05. The cytokine intensities of fluorescence (mean ratio ± SD, arbitrary units), respectively, for TNF-α and IL-12 were as follows. (a) monocytes mock-pretreated with LPS, 18·45 ± 7·3 and 13·6 ± 2·9; monocytes pretreated with 1 ng/ml LPS, 8·4 ± 2·5 and 5·6 ± 1·8; monocytes pretreated with 10 ng/ml LPS, <5 and <5; monocytes pretreated with 100 ng/ml LPS, <5 and <5; monocytes pretreated with 1000 ng/ml LPS, <5 and <5; and (b) monocytes mock-pretreated with LPS, 21·5 ± 8 and 15·3 ± 3·2; monocytes pretreated with 1 ng/ml LPS, 10·67 ± 3·7 and 6·9 ± 1·5; monocytes pretreated with 10 ng/ml LPS, 5·1 ± 1·1 and <5; monocytes pretreated with 100 ng/ml LPS, <5 and <5; monocytes pretreated with 1000 ng/ml LPS, <5 and <5.

