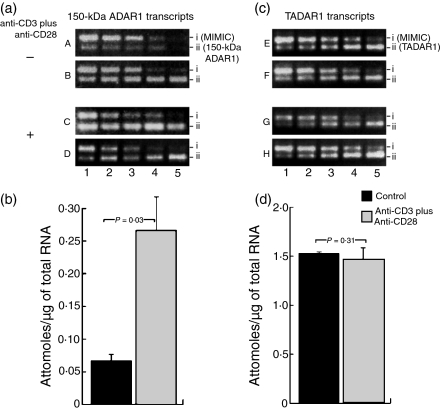
Figure 2.
Quantification of 150-kDa and 110-kDa adenosine deaminase that acts on RNA-1 (ADAR-1) gene transcripts in normal and activated T cells by competitive polymerase chain reaction (PCR). (a) All lanes contain PCR products derived from 10% of cDNA synthesized from 1 µg of total RNA isolated from normal or activated T cells along with twofold dilutions of neutral DNA fragments with gene-specific primer ends (MIMICs) for 150-kDa ADAR1. Amplified MIMICs (row i) and 150-kDa ADAR1 (row ii) transcripts are shown in A–D. A and B are from control T cells; C and D are from T cells activated with anti-CD3 plus anti-CD28. The concentrations of the 150-kDa ADAR1 MIMICs in attomoles in row i are: lane 1, 6·25 × 10−3; lane 2, 3·12 × 10−3; lane 3, 1·56 × 10−3; lane 4, 7·80 × 10−4; lane 5, 3·90 × 10−4 attomoles of 150-kDa ADAR1 MIMICs. (b) Histograms indicating the concentrations of 150-kDa ADAR1 transcripts from normal and activated T cells in attomoles/μg of total RNA. There was a 3·9-fold increase in the amount of 150-kDa ADAR1 gene transcripts (P = 0·03) in activated T cells compared with normal controls. (c) The quantity of total ADAR1 (TADAR1) was about 20-fold higher than that of 150-kDa ADAR1. To obtain better resolution of TADAR1 concentrations, 2% of cDNA synthesized from 1 µg of total RNA isolated from normal or activated T cells along with twofold dilutions of TADAR1 MIMICs was used, as described below. Amplified MIMICs and TADAR1 transcripts are shown in (c). Amplified MIMICs (row i) and TADAR1 (row ii) transcripts are shown in E–H. E and F are from control T cells; G and H are from T cells activated with anti-CD3 plus anti-CD28. The concentrations of the TADAR1 MIMICs in attomoles in row i are: lane 1, 2·5 × 10−2; lane 2, 1·25 × 10−2; lane 3, 6·25 × 10−3; lane 4, 3·12 × 10−3; lane 5, 1·56 × 10−3 attomoles, and each lane contains 2% of cDNA. (d) Mean concentrations, in attomoles/μg of total RNA, ± standard deviation (SD) of 110-kDa ADAR1 transcripts from normal and activated T cells. The concentrations of 110-kDa ADAR1 were obtained by subtracting the 150-kDa ADAR1 values from the TADAR1 values for the respective samples. No significant change (P = 0·30) was observed in the quantities of 110-kDa ADAR1 transcripts from control and activated T cells.

