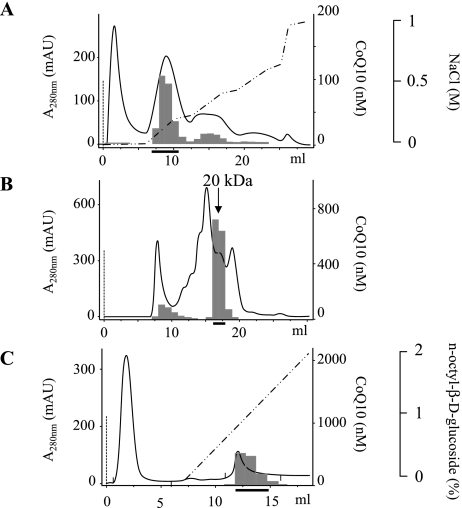
Fig. 1.
Chromatographic profiles of eluates from (A) DEAE sepharose, (B) Superdex 200, and (C) octyl sepharose columns utilized in the purification of saposin B from human urine. Solid bar and dotted line indicate the CoQ10 concentration in the fraction and protein concentration estimated from absorption at 280 nm, respectively. The broken solid line indicates the concentration of NaCl (A) or n-octyl-β-D-glucoside (C) in the eluates. The thick solid line indicates the fractions collected.

