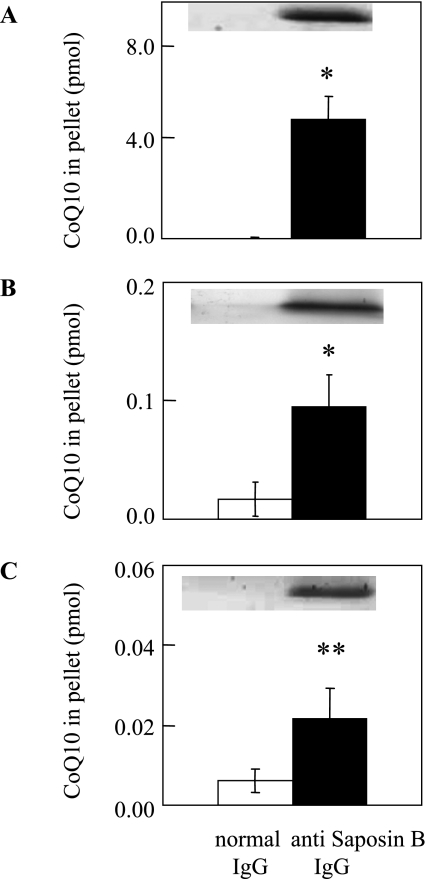
Fig. 3.
Presence of saposin B-CoQ10 complex in (A) human urine, (B) HepG2 cells and (C) human sperm. Solid and open bars show the CoQ10 contents in immunoprecipitates obtained with monoclonal anti-saposin B IgG and normal IgG, respectively. Values are means ± SD (n = 3). * and ** indicate significant differences (p<0.05 and 0.01, respectively) between the two groups, as analyzed by the Student t test. Upper panel shows the results of Western blotting with monoclonal anti-saposin B antibody.

