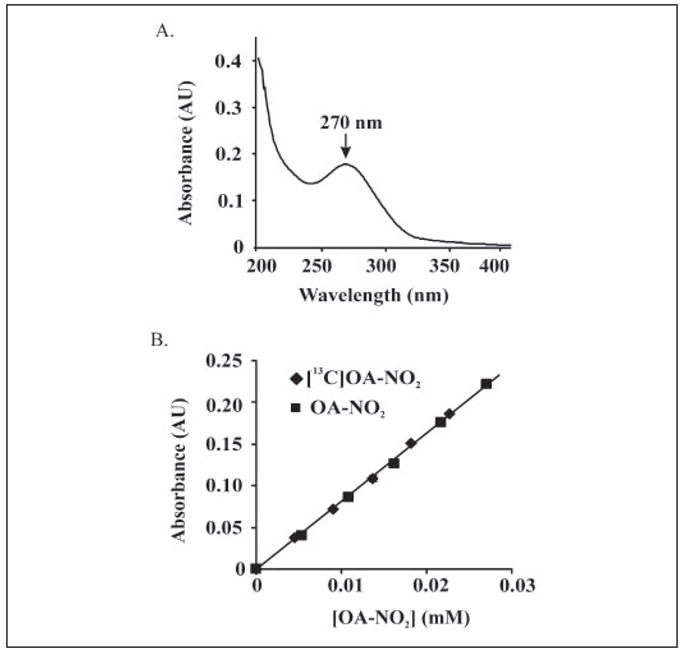
FIGURE 4. Spectrophotometric analysis of OA-NO2.

A, an absorbance spectrum of OA-NO2 from 200 – 450 nm was generated using 23 μM OA-NO2 in phosphate buffer (100 mM, pH 7.4) containing 100 μM DTPA. An absorbance maximum at 270 nm was identified. B, extinction coefficients for OA-NO2 and [13C18]OA-NO2 were determined by plotting absorbance (λ270) versus concentration, resulting in calculated values of ε = 8.22 and 8.23 cm−1·mM−1, respectively.
