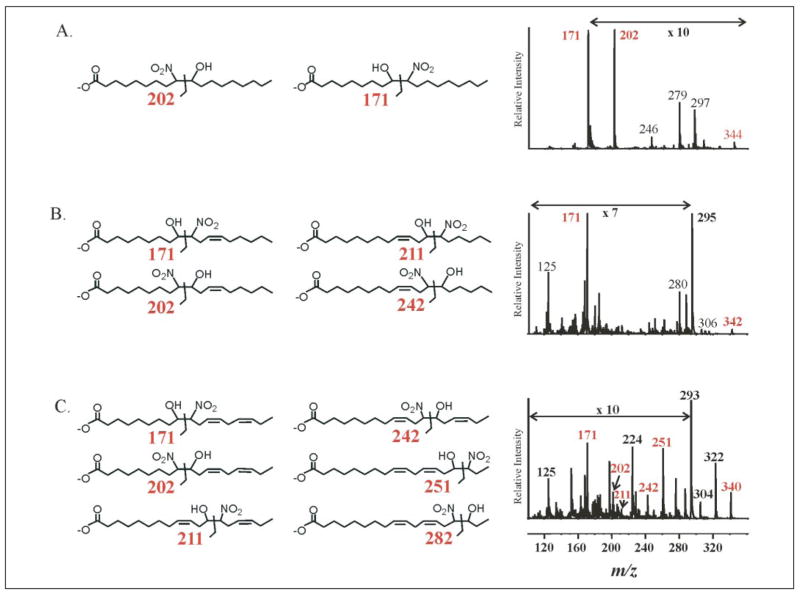
FIGURE 7. Structural analysis of nitrohydroxy fatty acid adducts in urine.
The presence of nitrohydroxy fatty acids in urine was confirmed using HPLC ESI MS/MS in the negative ion mode by performing product ion analyses concurrent to MRM detection. Structures of possible adducts are presented along with their diagnostic fragments and product ion spectra for 18:1(OH)-NO2 (A), 18:2(OH)-NO2 (B), and 18:3(OH)-NO2 (C). Some regions of the MS/MS fragmentation patterns are amplified, as indicated, to better convey structural information. The 10-nitro regioisomer of 18:1(OH)-NO2 is present in urine, as evidenced by the intense peak corresponding to m/z 171; also present are fragments consistent with the 9-nitro regioisomer (m/z 202), loss of a nitro group (m/z 297), and water (m/z 326). 18:2(OH)-NO2 also shows a predominant m/z 171 fragment, again consistent with an oxidation product of LNO2 nitrated at the 10-carbon (B). Diagnostic fragments for the three other potential regioisomers were not apparent. Finally, multiple regioisomers of 18:3(OH)-NO2 are present (C).

